
June 2018 Paper 2 Q3
3 Ayesha, Bob, Chloe and Dave are discussing the relationship between the time, \(t\) hours, they might spend revising for an examination, and the mark, \(m\), they would expect to gain. Each of them draws a graph to model this relationship for himself or herself.
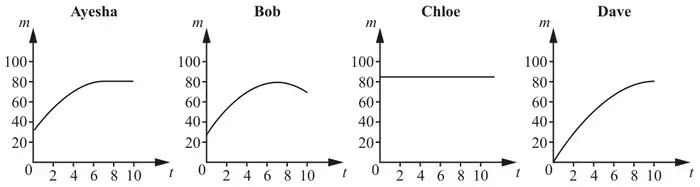
(i) Assuming Ayesha’s model is correct, how long would you recommend that she spends revising? [1]
(ii) State one feature of Dave’s model that is likely to be unrealistic. [1]
(iii) Suggest a reason for the shape of Bob’s graph as compared with Ayesha’s graph. [1]
(iv) What does Chloe’s model suggest about her attitude to revision? [1]
| Scheme | Marks | AO |
|---|---|---|
| 7 hours | B1 | 2.2b |
| [1] |
Notes
B1: Allow between 6 and 8 hours.
| Scheme | Marks | AO |
|---|---|---|
| Dave will gain no marks even if he does no revision | B1 | 3.5a |
| [1] |
Notes
B1: oe
| Scheme | Marks | AO |
|---|---|---|
| (Bob believes) too much revision leads to tiredness (or less sleep or stress or forgetting) and hence a lower mark. (Ayesha does not.) | B1 | 3.5a |
| [1] |
Notes
B1: oe Must suggest reason for drop in marks
| Scheme | Marks | AO |
|---|---|---|
| (She believes that) however much or little revision she does it will make no difference to the mark she obtains | B1 | 2.2b |
| [1] |
Notes
B1: or (She thinks)
revision will not increase her mark
or revision is unnec'y to obtain high mark
revision is unhelpful oe