
October 2021 Paper 2 Q2
2 Mia rolls a six-sided die 24 times and records the scores. She displays her results in a vertical line chart. This is shown in Fig. 2.1.
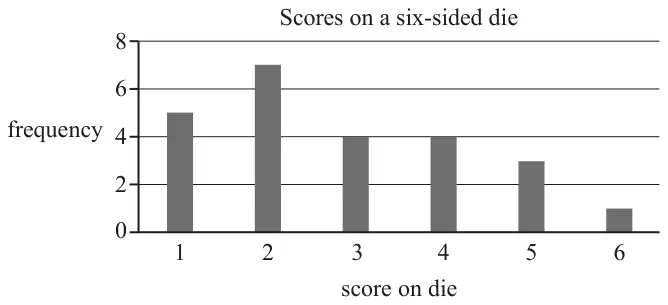
(a) Describe the shape of the distribution. [1]
She repeats the experiment, but this time she rolls the die 50 times. Her results are displayed in Fig. 2.2.
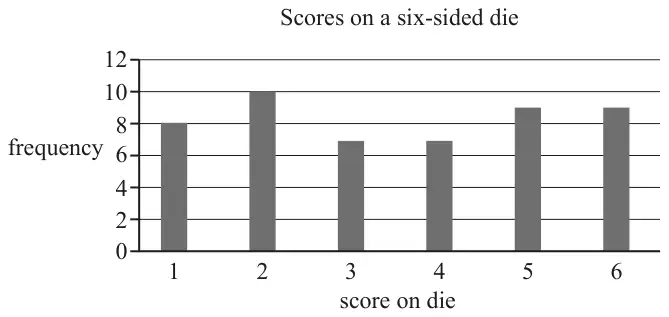
Her brother Kai rolls the same die 1000 times and displays his results in a similar diagram.
(b) Assuming the die is fair, describe the distribution you would expect to see in Kai’s diagram. [1]
| Scheme | Marks |
|---|---|
| Positive skew | B1 |
| [1] |
Notes
B1: Oe
| Scheme | Marks |
|---|---|
| (discrete) uniform | B1 |
| [1] |
Notes
B1: Oe