
October 2020 Paper 2 Q10
10 Fig. 10.1 shows a sample collected from the large data set.
BMI is defined as \(\dfrac{\text{mass of person in kilograms}}{\text{square of person’s height in metres}}\).
| Sex | Age in years | Mass in kg | Height in cm | BMI |
|---|---|---|---|---|
| Male | 38 | 77.6 | 164.8 | 28.57 |
| Male | 17 | 63.5 | 170.3 | 21.89 |
| Male | 18 | 68.0 | 172.3 | 22.91 |
| Male | 18 | 57.2 | 172.2 | 19.29 |
| Male | 19 | 77.6 | 191.2 | 21.23 |
| Male | 24 | 72.7 | 177.0 | 23.21 |
| Male | 25 | 92.5 | 177.9 | 29.23 |
| Male | 26 | 70.4 | 159.4 | 27.71 |
| Male | 31 | 77.5 | 174.0 | 25.60 |
| Male | 34 | 132.4 | 182.2 | 39.88 |
| Male | 38 | 115.0 | 186.4 | 33.10 |
| Male | 40 | 112.1 | 171.7 | 38.02 |
Fig. 10.1
(a) Calculate the mass in kg of a person with a BMI of 23.56 and a height of 181.6 cm, giving your answer correct to 1 decimal place. [2]
Fig. 10.2 shows a scatter diagram of BMI against age for the data in the table. A line of best fit has also been drawn.
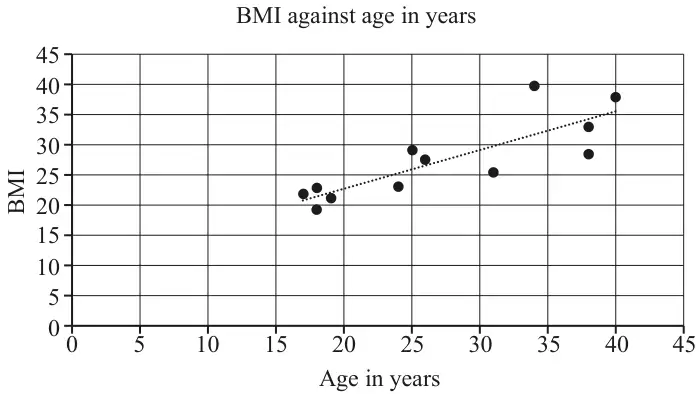
(b) Describe the correlation between age and BMI. [1]
(c) Use the line of best fit to estimate the BMI of a 30-year-old man. [1]
(d) Explain why it would not be sensible to use the line of best fit to estimate the BMI of a 60-year-old man. [1]
(e) Use your knowledge of the large data set to suggest two reasons why the sample data in the table may not be representative of the population. [2]
(f) Once the data in the large data set had been cleaned there were 196 values available for selection. Describe how a sample of size 12 could be generated using systematic sampling so that each of the 196 values could be selected in the sample. [2]
| Scheme | Marks | AO |
|---|---|---|
| Mass \(= 23.56 \times 1.816^2\) | M1 | 1.1 |
| = 77.7 [kg] | A1 | 1.1 |
| [2] |
Notes
M1: Allow M1 for cm used here
A1: CAO
| Scheme | Marks | AO |
|---|---|---|
| Positive [correlation] | B1 | 1.1 |
| [1] |
Notes
B1: Ignore, eg, weak or strong
Accept ‘as age increases so does BMI’ oe
| Scheme | Marks | AO |
|---|---|---|
| \(28 \leqslant \text{BMI} < 30\) | B1 | 3.4 |
| [1] |
| Scheme | Marks | AO |
|---|---|---|
| extrapolation | B1 | 3.5b |
| [1] |
Notes
B1: Or equivalent
| Scheme | Marks | AO |
|---|---|---|
| eg females in population | B1 | 2.2b |
| wider age range in population | B1 | 2.2b |
| scatter diagram for whole population shows very weak negative correlation | ||
| [2] |
Notes
any two distinct comments
| Scheme | Marks | AO |
|---|---|---|
| Eg Generate a random number, \(n\), between 1 and (eg 20) inclusive and select the \(n\)th item in the data set OR select every \(m\)th (eg 16th value). | M1 | 1.2 |
| For valid solution. | A1 | 1.1 |
| [2] |
Notes
Random no between 1 and 9 and every 17th item would also work.
Random no between 1 and 31, and then every 15th item also works, etc.