
October 2021 Paper 2 Q12
12 Fig. 12.1 shows an excerpt from the pre-release material.
| A | B | C | D | E | F | G | H | |
|---|---|---|---|---|---|---|---|---|
| 1 | Sex | Age | Marital | Weight | Height | BMI | Waist | Pulse |
| 2 | Female | 34 | Married | 60.3 | 173.4 | 20.05 | 82.5 | 74 |
| 3 | Female | 85 | Widowed | 64.7 | 161.2 | 24.9 | #N/A | #N/A |
| 4 | Female | 48 | Divorced | 100.6 | 171.4 | 34.24 | 105.6 | 92 |
| 5 | Male | 61 | Married | 70.9 | 169.5 | 24.68 | 92.2 | 70 |
| 6 | Male | 68 | Divorced | 96.8 | 181.6 | 29.35 | 112.9 | 68 |
Fig. 12.1
There was no data available for cell H3.
(a) Explain why #N/A is used when no data is available. [1]
Fig. 12.2 shows a scatter diagram of pulse rate against BMI (Body Mass Index) for females.
All the available data was used.
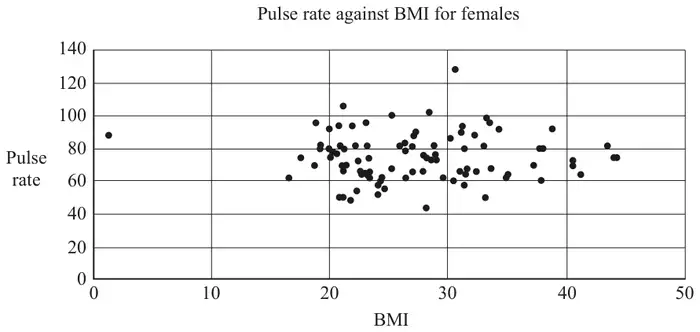
There are two outliers on the diagram.
(b) On the copy of Fig. 12.2 in the Printed Answer Booklet, ring these outliers. [1]
(c) Use your knowledge of the pre-release material to explain whether either of these outliers should be removed. [2]
(d) State whether the diagram suggests there is any correlation between pulse rate and BMI. [1]
The product moment correlation coefficient between waist measurement, \(w\), in cm and BMI, \(b\), for females was found to be 0.912. All the available data was used.
(e) Explain why a model of the form \(w = mb + c\) for the relationship between waist measurement and BMI is likely to be appropriate. [1]
The LINEST function on a spreadsheet gives \(m = 2.16\) and \(c = 33.0\).
(f) Calculate an estimate of the value for cell G3 in Fig. 12.1. [1]
| Scheme | Marks | AO |
|---|---|---|
| #N/A is used to stop the software reading the entry as zero | B1 | 2.4 |
| [1] |
Notes
B1: allow so that the cell is ignored oe
or the software interprets #N/A as no data oe
advantage
| Scheme | Marks | AO |
|---|---|---|
| (30.6, 128) and (1.3,88) ringed | B1 | 1.1 |
| [1] |
| Scheme | Marks | AO |
|---|---|---|
| outlier on extreme left oe should be removed as nobody could have a BMI this low oe | B1 | 2.4 |
| outlier with (very) high pulse rate oe should not be removed as it is plausible oe | B1 | 2.4 |
| [2] |
Notes
B1: need to refer to BMI being implausible
advantage
B1: advantage
| Scheme | Marks | AO |
|---|---|---|
| no correlation | B1 | 2.2b |
| [1] |
Notes
B1: ignore other comments unless contradictory
| Scheme | Marks | AO |
|---|---|---|
| because the value of pmcc is close to 1 or because there is strong correlation oe | B1 | 2.2b |
| [1] |
| Scheme | Marks | AO |
|---|---|---|
| 86.784, 86.78 or 86.8 | B1 | 3.4 |
| [1] |
Notes
B1: isw