
June 2023 Paper 2 Q8
8 A garden centre stocks coniferous hedging plants. These are displayed in 10 rows, each of 120 plants. An employee collects a sample of the heights of these plants by recording the height of each plant on the front row of the display.
The data are shown in the cumulative frequency curve below.
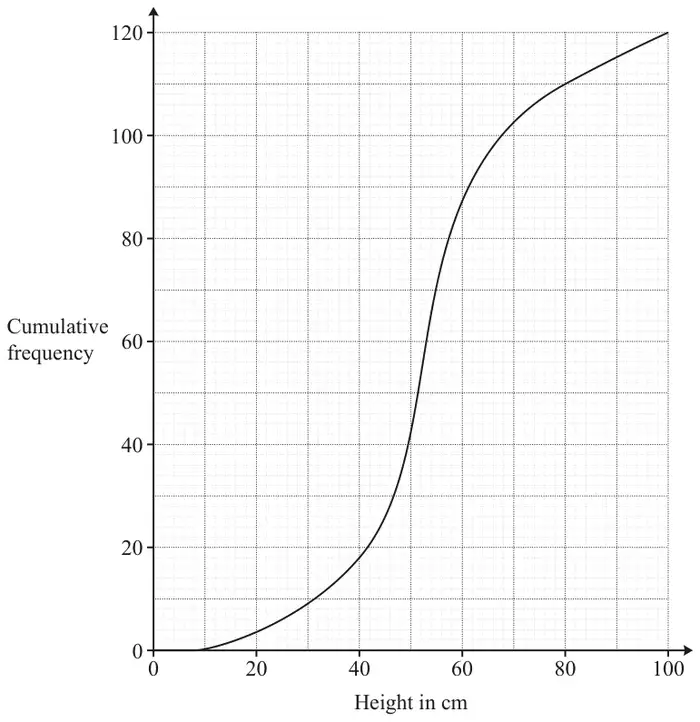
The owner states that at least 75% of the plants are between 40 cm and 80 cm tall.
| Scheme | Marks | AO |
|---|---|---|
| not a simple random sample since each possible sample does not have an equal probability of being selected | B1 | 2.4 |
| [1] |
Notes
B1: allow “not a simple random sample since each plant does not have an equal probability of being selected”
ignore further comments unless contradictory
the essential elements of the comment are in bold
| Scheme | Marks | AO |
|---|---|---|
| 18 (shorter than 40 cm) seen | B1 | 2.1 |
| 110 (shorter than 80 cm) or 10 (taller than 80 cm) seen | B1 | 1.1 |
| \(\frac{92}{120}\) oe or \(\frac{28}{120}\) oe | M1 | 1.1 |
| awrt 77% > 75% oe so this supports the (owner’s) statement | A1 | 2.2a |
| [4] |
Notes
B1: may be embedded in calculation
B1: may be embedded in calculation
M1: FT their 18 and their 110; allow M1 for \(\frac{91}{120}\) or \(\frac{29}{120}\) oe
or \(\frac{75}{100} \times 120 = 90\) oe
A1: or 92 > 90 so this supports the (owner’s) statement; need comparison and comment
| Scheme | Marks | AO |
|---|---|---|
| must refer to sample in answer eg since different samples give different results, not all samples would necessarily support owner’s statement eg no since another sample may contain all the tallest plants (and/or shortest) eg no since the heights in other samples may be different | B1 | 2.4 |
| [1] |
Notes
B1: ignore superfluous comments referring to eg growing conditions, soil type etc
do not allow
eg no, conditions different for other plants
eg no, different plants on different rows
eg no, might be biggest and smallest plants on other rows
eg the first sample is not representative