
June 2024 Paper 3 Q10
10 The diagram below shows the curve \(y = \mathrm{f}(x)\).
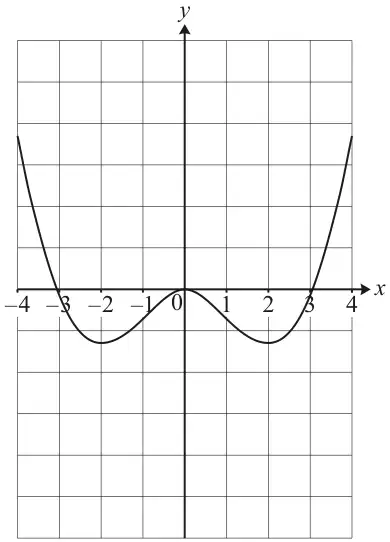
Sketch the graph of the gradient function, \(y = \mathrm{f}^{\prime}(x)\), on the copy of the diagram in the Printed Answer Booklet. [3]
| Scheme | Marks | AO |
|---|---|---|
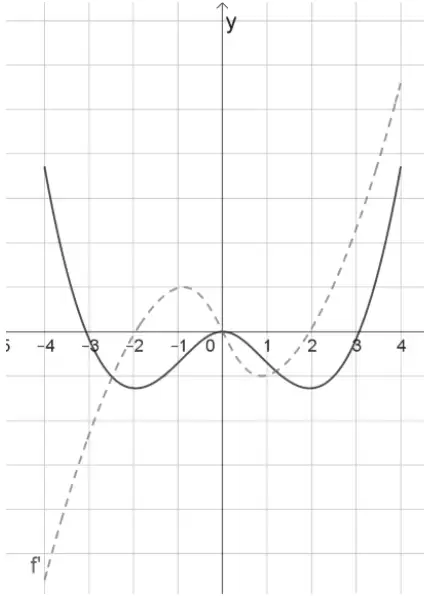 | B1 B1 B1 | 3.1a 2.2a 2.2a |
| [3] |
Notes
B1: Zeroes at 0 and close to -2 and 2 (and no others)
B1: Rotational symmetry about the origin (mark intent)
B1: General shape (actual values of gradient may be wrong)
Additional guidance
The 3 marks are independent.
The first one is for showing the crossing points are 0 and near to +2 and -2.
The second is for rotational symmetry (or close to).
The third is for the general shape of a positive cubic But do not condone incorrect curvature. Some candidates are drawing y=x, which scores B0B1B0.
In all cases use your judgement and mark the intention of the candidate.
List all 3 marks in the order of the MS.