
June 2018 Paper 1 Q10
10 Fig. 10 shows the graph of \(y = (k - x)\ln x\) where \(k\) is a constant \((k > 1)\).
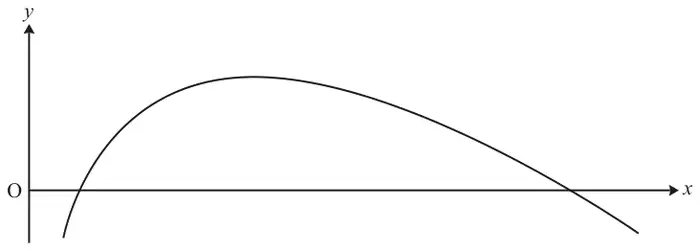
Find, in terms of \(k\), the area of the finite region between the curve and the \(x\)-axis. [8]
| Scheme | Marks | AO |
|---|---|---|
| Curve crosses the \(x\)-axis when \(y = 0\) \(y = (k - x)\ln x = 0\) | M1 | 3.1a |
| Either \(k - x = 0\) or \(\ln x = 0\) \(x = k\) or 1 | A1 | 1.1b |
| EITHER Area \(= \displaystyle\int_1^k (k - x)\ln x\,\mathrm{d}x\) Let \(u = \ln x,\ \dfrac{\mathrm{d}v}{\mathrm{d}x} = k - x,\ \dfrac{\mathrm{d}u}{\mathrm{d}x} = \dfrac{1}{x},\ v = kx - \tfrac{1}{2}x^2\) | M1 | 2.1 |
| Area \(= \displaystyle\left[\left(kx - \tfrac{1}{2}x^2\right)\ln x\right]_1^k - \int_1^k \frac{1}{x}\left(kx - \tfrac{1}{2}x^2\right)\mathrm{d}x\) | A1 | 1.1b |
| \(\displaystyle\left[\left(kx - \tfrac{1}{2}x^2\right)\ln x\right]_1^k - \int_1^k \left(k - \tfrac{1}{2}x\right)\mathrm{d}x\) | M1 | 3.1a |
| \(\left[\left(kx - \tfrac{1}{2}x^2\right)\ln x - \left(kx - \tfrac{1}{4}x^2\right)\right]_1^k\) | A1 | 1.1b |
| \(\left(\left(k^2 - \tfrac{1}{2}k^2\right)\ln k - \left(k^2 - \tfrac{1}{4}k^2\right)\right) - \left(\left(k - \tfrac{1}{2}\right)\ln 1 - \left(k - \tfrac{1}{4}\right)\right)\) | M1dep | 1.1a |
| \(= \tfrac{1}{2}k^2\ln k - \dfrac{3}{4}k^2 + k - \dfrac{1}{4}\) | A1 | 1.1b |
| [8] |
Notes
M1: Attempt to solve \(y = 0\)
A1: Both roots required
M1: Using integration by parts with \(u = \ln x,\ \dfrac{\mathrm{d}v}{\mathrm{d}x} = k - x\) clearly argued
A1: Allow without limits
M1: Simplifying the integrand
A1: Second part correct
M1dep: Using limits. Dependent on M mark for integration by parts
A1: Cao
OR
| Scheme | Marks |
|---|---|
| OR Integral split into two separate integrals \(\displaystyle\int_1^k k\ln x\,\mathrm{d}x\) Let \(u = \ln x,\ \dfrac{\mathrm{d}v}{\mathrm{d}x} = k,\ \dfrac{\mathrm{d}u}{\mathrm{d}x} = \dfrac{1}{x},\ v = kx\) | M1 |
| \(\displaystyle= \left[kx\ln x\right]_1^k - \int_1^k \frac{1}{x}kx\,\mathrm{d}x\) | M1 |
| \(\displaystyle\left[kx\ln x\right]_1^k - \int_1^k k\,\mathrm{d}x = \left[kx\ln x - kx\right]_1^k\) \(\left(k^2\ln k - k^2\right) - \left(k\ln 1 - k\right) = k^2\ln k - k^2 + k\) | M1dep |
| And Area \(= \displaystyle\int_1^k x\ln x\,\mathrm{d}x\) Let \(u = \ln x,\ \dfrac{\mathrm{d}v}{\mathrm{d}x} = x,\ \dfrac{\mathrm{d}u}{\mathrm{d}x} = \dfrac{1}{x},\ v = \tfrac{1}{2}x^2\) \(\displaystyle= \left[\tfrac{1}{2}x^2\ln x\right]_1^k - \int_1^k \frac{1}{x} \times \tfrac{1}{2}x^2\,\mathrm{d}x\) | A1 |
| \(\displaystyle\left[\tfrac{1}{2}x^2\ln x\right]_1^k - \int_1^k \tfrac{1}{2}x\,\mathrm{d}x\) \(\left[\tfrac{1}{2}x^2\ln x - \tfrac{1}{4}x^2\right]_1^k\) | A1 |
| \(\left(\tfrac{1}{2}k^2\ln k - \tfrac{1}{4}k^2\right) - \left(\tfrac{1}{2}\ln 1 - \tfrac{1}{4}\right) = \tfrac{1}{2}k^2\ln k - \dfrac{1}{4}k^2 + \dfrac{1}{4}\) Area \(= \left(k^2\ln k - k^2 + k\right) - \left(\tfrac{1}{2}k^2\ln k - \dfrac{1}{4}k^2 + \dfrac{1}{4}\right)\) \(= \tfrac{1}{2}k^2\ln k - \dfrac{3}{4}k^2 + k - \dfrac{1}{4}\) | A1 |
M1: Using integration by parts with \(u = \ln x,\ \dfrac{\mathrm{d}v}{\mathrm{d}x} = k\) or \(u = \ln x,\ \dfrac{\mathrm{d}v}{\mathrm{d}x} = \pm x\) clearly argued
M1: Simplifying the integrand
M1dep: Substituition of limits seen in at least one integral. Dependent on M mark for integration by parts
A1: Both integrals correct at this stage
Allow without limits
A1: Both integrals fully correct
Allow without limits
A1: Cao