
Higher November 2020 Paper 2 Q5
5. The graph shows the number of copies of a local newspaper sold over a 25-year period.
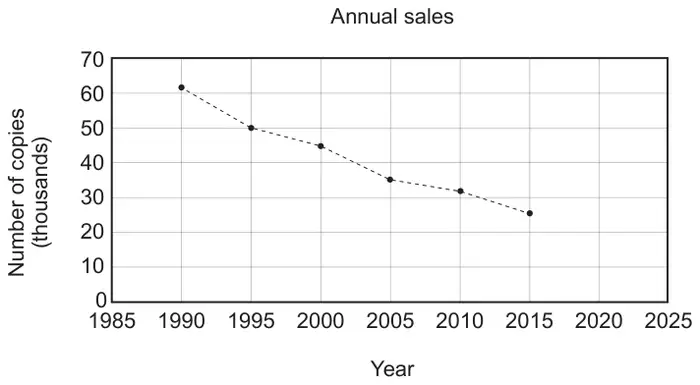
(a) Eva uses the graph to predict that about 10 thousand newspapers will be sold in 2025.
Explain why her prediction may not be reliable. [1]
Explain why her prediction may not be reliable. [1]
(b) The ratio of adults who read news online to those who do not is 16 : 9.
The adult population of the UK is about 52 000 000.
Calculate an estimate of the number of adults in the UK who read news online. [2]
The adult population of the UK is about 52 000 000.
Calculate an estimate of the number of adults in the UK who read news online. [2]
| Scheme | Marks | Comments |
|---|---|---|
| Any valid reason e.g. ‘10 years is too far ahead to predict’ ‘the paper might not be produced if sales continue to fall’ ‘the change each time is not consistent’ | B1 | If a satisfactory reason is given ignore further spurious comments. Allow e.g. ‘because the sales may not follow the pattern of the graph’ ‘there is not an equal; drop in numbers sold every 5 years’ ‘it’s too far in the future we cannot tell’ ‘it could increase instead of decrease’ ‘more people may read the paper on the internet’ Do not allow statements that do not relate to the graph e.g. ‘there might be more or less than 10 000 sold in 2025’ as no reference to the trend ‘we can’t tell’ as no reference to time or trend |
| Scheme | Marks | Comments |
|---|---|---|
| (52 000 000 ÷ (16 + 9)) ×16 | M1 | Allow a place value slip in 52 000 000 for M1 only |
| 33 280 000 | A1 | Allow 33 000 000 and 33 300 000 |
| (3) |
Corrected by Westie's Workshop
- The board's mark scheme printed “(52 000 000 ÷ (16 + 9) ×16”. Changed to “(52 000 000 ÷ (16 + 9)) ×16” because a closing bracket was missing; the calculation is 52 000 000 ÷ 25 × 16 = 33 280 000.
Original: see the board's mark scheme PDF (link above).