
Higher November 2018 Paper 2 Q19
19. The graph shows the velocity of a car during the first hour of a journey.
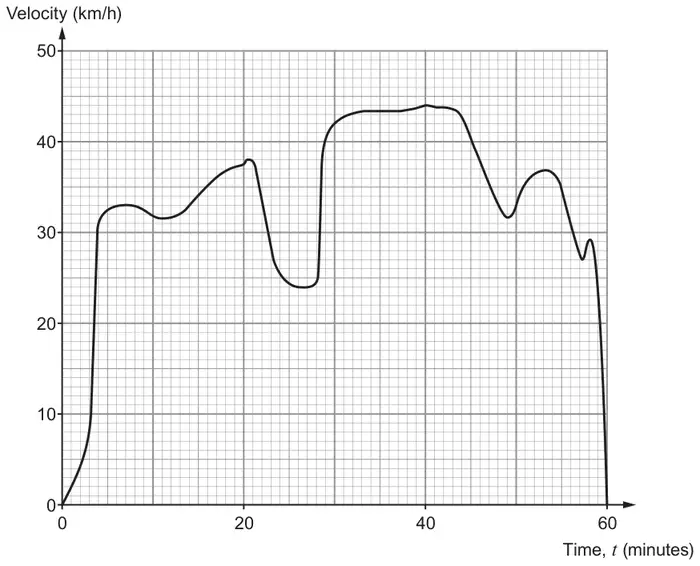
(a) At \(t = 4\), find the velocity of the car in km/min. [1]
(b) Calculate the acceleration of the car when \(t = 17\).
Give your answer in km/min2. [3]
Give your answer in km/min2. [3]
(c) Calculate the average acceleration of the car between \(t = 40\) and \(t = 50\).
Give your answer in km/h2. [2]
Give your answer in km/h2. [2]
| Scheme | Marks | Comments |
|---|---|---|
| \((30 \div 60 =)\) 0.5 (km/min) | B1 | Accept an answer in the range 0.46(km/min) to 0.52(km/min) |
| Scheme | Marks | Comments |
|---|---|---|
| Tangent drawn at \(t = 17\) | B1 | |
| \(\dfrac{\text{difference in } y \text{ values}}{\text{difference in } x \text{ values}}\ (\div\ 60)\) | M1 | Allow with \(\div\ 60\) for change of units omitted for M1 only |
| ........ (km/min2) | A1 | (Note: 0.01 to 0.03 km/min2) |
| Scheme | Marks | Comments |
|---|---|---|
| \((33 - 44) \div 10\ \ (\times 60)\) | M1 | Allow \((44 - 33) \div 10\ (\times 60)\) Allow with \(\times 60\) for change of units omitted for M1 only |
| −66 (km/h2) | A1 | Must be negative |
| (6) |