14. Cally, Deena and Juan are working on a GCSE project. They are each in a different class. Cally, Deena and Juan each record the journey times to school of pupils in their own class.
(a) The times for pupils in Cally’s class are shown in the table below.
Journey time, \(t\) (minutes)
Number of pupils
\(0 \lt t \leqslant 5\)
5
\(5 \lt t \leqslant 15\)
5
\(15 \lt t \leqslant 30\)
6
\(30 \lt t \leqslant 50\)
5
\(50 \lt t \leqslant 60\)
4
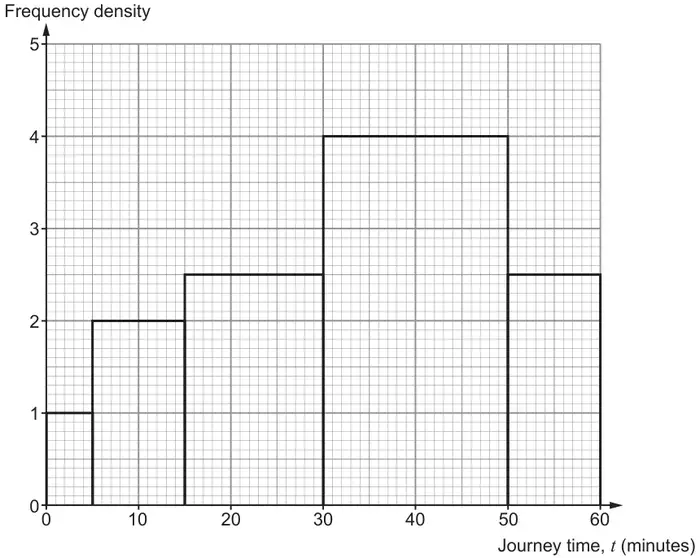
She decides to draw a histogram of her results.Most of the frequency densities used in the histogram are incorrect. What error did Cally make when she calculated the frequency densities? [1]
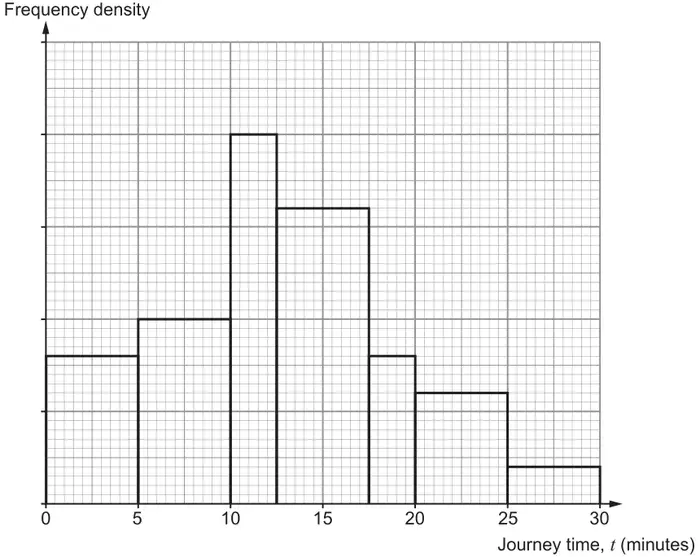
(b) Deena has correctly drawn the histogram for her results. 4 pupils take between 0 and 5 minutes to travel to school.
(i) Complete the scale on the frequency density axis. [2]
(ii) Calculate an estimate of the median journey time for the pupils in Deena’s class. You must show all your working. [3]
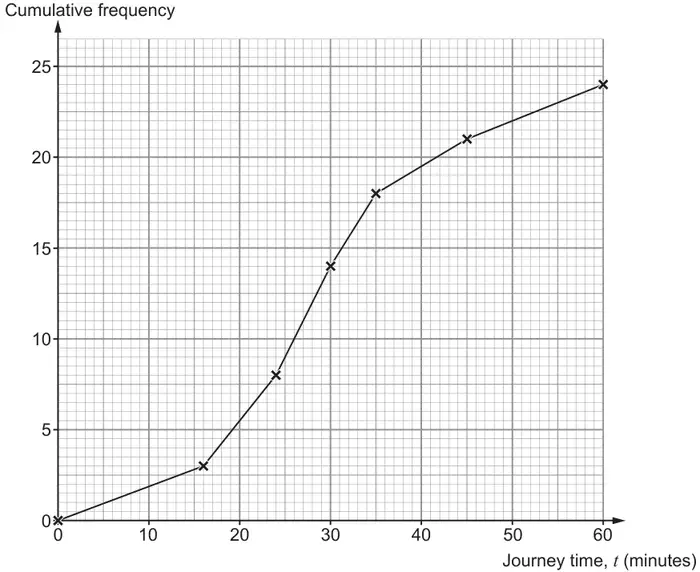
(c) Juan decides to display the journey times of the 24 pupils for his class on a cumulative frequency diagram.Use the cumulative frequency diagram to give the best estimates for the answers to each of the following questions.
(i) Calculate the percentage of pupils in Juan’s class that take 45 minutes or longer to travel to school. [3]
(ii) Complete the table for the journey time to school of the pupils in Juan’s class. [3]
(iii) Two pupils were absent when Juan collected his data. The journey times of these two pupils are 6 minutes and 40 minutes.
What effect would including these two results have on the median journey time for the class? [1]
Mark scheme (a)
Scheme
Marks
Comments
An explanation relating to calculating incorrect frequency densities e.g.
It should be frequency divided by width of bar for heights of bars not the other way around
She has calculated width divided by frequency
E1
Allow e.g. ‘journey time’ rather than ‘width of bar’
Do not allow e.g. ‘Journey time x frequency density is not equal to the number of pupils’
The areas of the bars do not give the frequencies
Mark scheme (b)
Scheme
Marks
Comments
(b)(i) A correct uniform scale with intervals of 0·5
Minimum of fd labels 1 and 2, any other labels must be correct
B2
If not B2, award B1 for 1 label correct and none incorrect e.g.
0·8 marked correctly
0·5 or 1 marked correctly
OR a correct uniform scale, with intervals of 0.5 to the top of the histogram with errors above
OR
4/5 or 0·8 seen in calculations.
(b)(ii)
STRICT FT their labelling for a uniform scale only, provided uniform to at least the top of the histogram, for possible M1A1B1
We'd like to use Google Analytics cookies to count visits and see which pages help most. They're optional, and the site works exactly the same either way. Privacy policy