
Higher June 2024 Paper 2 Q16
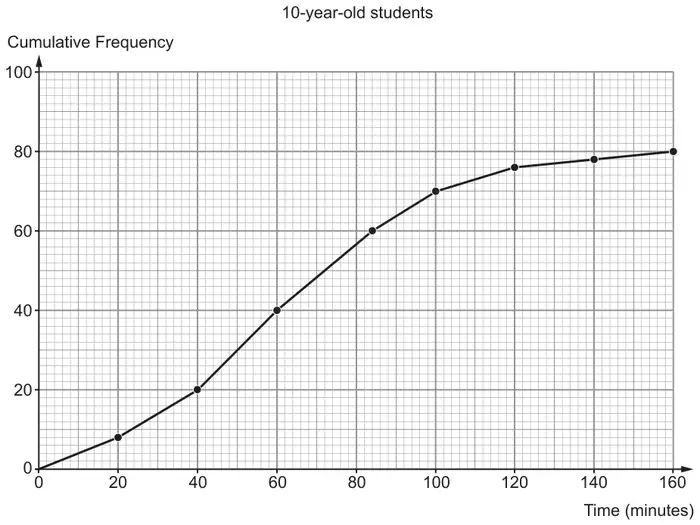
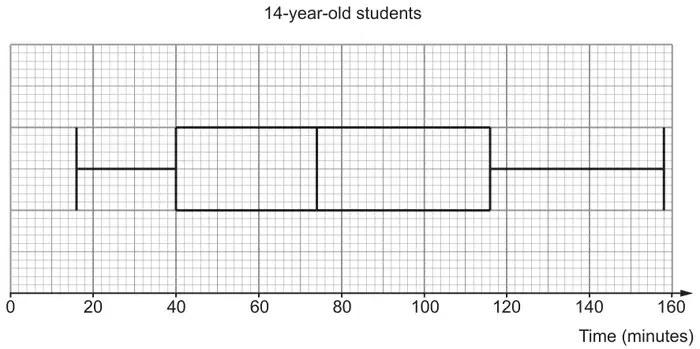
16. A video game company investigated how long, in minutes, one group of 10-year-old students and one group of 14-year-old students spent playing video games last Wednesday evening.
Diagrams displaying the results for each age group are shown below.
(a) Lewis says,
“14-year-olds spend longer, on average, playing video games than 10-year-olds.”
Is Lewis correct?Yes ☐ No ☐
Use information from the diagrams to justify your answer. [1](b) Complete the following sentences using information from the diagrams.
(i) The percentage of 14-year-old students that spent less than 40 minutes playing video games last Wednesday evening was ………………… %. [1]
(ii) The percentage of 10-year-old students that spent more than 120 minutes playing video games last Wednesday evening was ………………… %. [2]
(c) Compare the inter-quartile range of the times each age group spent playing video games last Wednesday evening.
What conclusions can you draw about the length of time 10-year-olds and 14-year-olds spent playing video games last Wednesday evening? [2]
What conclusions can you draw about the length of time 10-year-olds and 14-year-olds spent playing video games last Wednesday evening? [2]
| Scheme | Marks | Comments |
|---|---|---|
| Yes indicated, or implied, with a valid reason referencing 60 and 74 e.g. ‘The median (time playing video games) for 14-year-olds is 74 minutes and the median (time playing video games) for 10-year-olds is 60 minutes.’ ‘The median for 14-year-olds is 14 (minutes) larger (than the median for 10-year-olds).’ May be in two separate statements | E1 | Check diagrams for values. Allow e.g. ‘The average (time playing video games) for 14-year-olds is 74 minutes and the average (time playing video games) for 10-year-olds is 60 minutes.’ ‘50% of 10-year-olds spent 60 minutes or more, whereas 50% of 14-year-olds spent 74 minutes or more’. ’74 is greater than 60.’ Do not allow e.g. ‘The median for 14-year-olds is 74 minutes and the median for 10-year-olds is 72 minutes.’ ‘The median for 14-year-olds is bigger than the median for 10-year-olds’ unless both medians seen on the diagrams. |
| Scheme | Marks | Comments |
|---|---|---|
| (b)(i) 25 | B1 | |
| (b)(ii) \(\dfrac{80-76}{80}\ (\times100)\) | M1 | |
| 5 | A1 | Answer line takes precedence. If no marks awarded, award SC1 for 95%. |
| Scheme | Marks | Comments |
|---|---|---|
| IQR (for 10-year-olds) = 44(minutes) AND IQR (for 14-year-olds) = 76(minutes) With a valid conclusion e.g. ’14-year-olds have a bigger variation/spread of times (spent playing video games) than 10-year-olds.’ | E2 | Check for values given on the diagrams Allow use ‘range’ instead of IQR in the conclusion for E2 or E1 E1 for both correct values for the IQR without a conclusion or with an incorrect conclusion. OR E1 for one IQR correctly and the other incorrectly calculated with the correct FT conclusion. Do not allow e.g. ‘The number of 14-year-olds (who played videogames) is more varied as the IQR is higher’ |
| (6) |