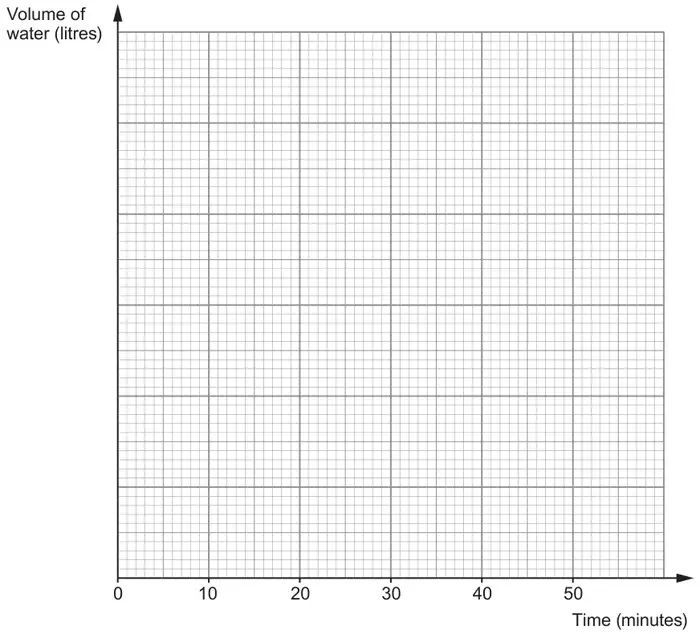
4. A tank contains 225 litres of water. A tap at the bottom is opened so that water flows out at a constant rate of 5 litres every minute until the tank is empty.
(a) On the graph paper below, draw a line to show the volume of water in the tank at any time after the tap has been opened. [4]
(b) How many minutes does it take for the volume of water in the tank to decrease by 40% of the original volume? [2]
Mark scheme (a)
Scheme
Marks
Comments
Uniform scale used on vertical axis
B1
Plots accurate to within ½ a small square but mark intent Must allow plots up to 225 litres and start at zero
Line starting at (0, 225)
B1
According to their scale
Single straight line with correct gradient si
B1
e.g. single straight line passing through any two of (10, 175), (20, 125), (30, 75), (40, 25), (45,0) according to their scale
or line drawn using e.g. 50 litres = 10 minutes to plot and join points
Ruled, single straight line ending at (45, 0)
B1
Mark scheme (b)
Scheme
Marks
Comments
(225 ÷ 10) × 6 or 135 OR (225 ÷ 10) × 4 or 90 OR (225 ÷ 10) × 4 ÷ 5 or (45 ÷ 10) × 4 oe
M1
Ignore units if stated
Equivalent calculations for M1 e.g. (50% + 10% = )112.5 + 22.5 or (50% - 10% = ) 112.5 – 22.5
18 (minutes)
A1
if 90 or 135 found and using correct graph accept 17 – 19 mins
FT ‘their single straight line’ read at a volume = 135 providing that it has negative gradient; allow good freehand here
Accept 18 mins even if graph incorrect as can be done without it e.g. 90 ÷ 5
We'd like to use Google Analytics cookies to count visits and see which pages help most. They're optional, and the site works exactly the same either way. Privacy policy