
Foundation November 2020 Paper 1 Q2
2. Some workers in a large shop were asked to choose the month in which they would like to take a holiday.
Each worker chose a month from May to September.
The vertical line graph and pictogram each show the results for three of the five months.
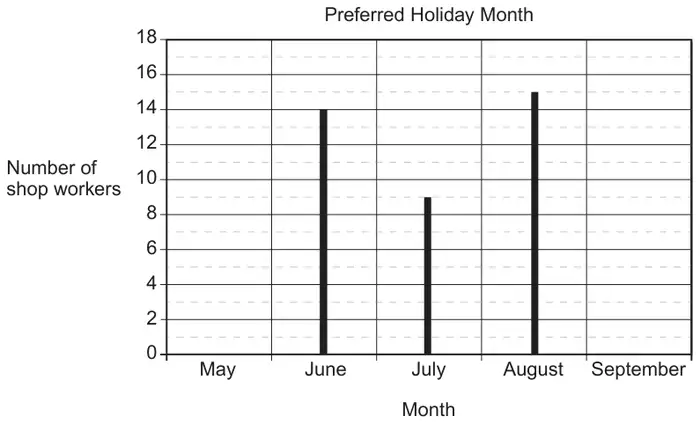
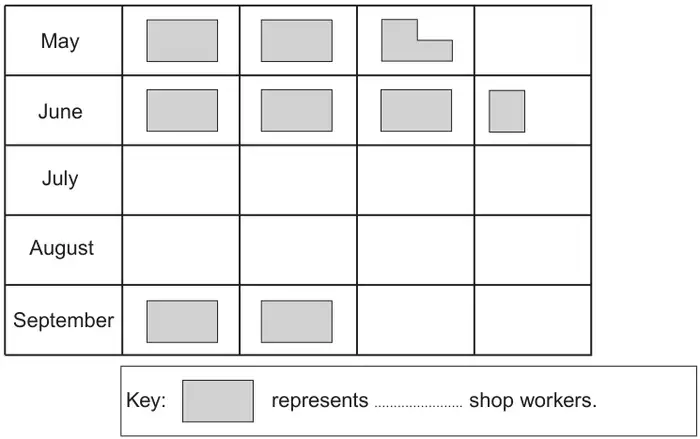
(a) Complete the vertical line graph, pictogram and key. [3]
(b) How many shop workers were asked? [1]
(c) Write down the modal month. [1]
| Scheme | Marks | Comments |
|---|---|---|
| Lines drawn at 11 for May and 8 for Sept Correct pictogram diagrams for July e.g. 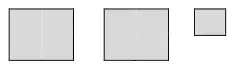  | B3 | Mark intent; must be lines not bars B2 for any 3 or 4 correct or B1 for any 2 correct |
| Scheme | Marks | Comments |
|---|---|---|
| 57 | B1 | FT either diagram; for pictogram, key must be completed if FT |
| Scheme | Marks | Comments |
|---|---|---|
| August CAO | B1 | Allow August and 15 (but not just 15 only) |
| (5) |