
Foundation November 2017 Paper 1 Q14
14.
(a) 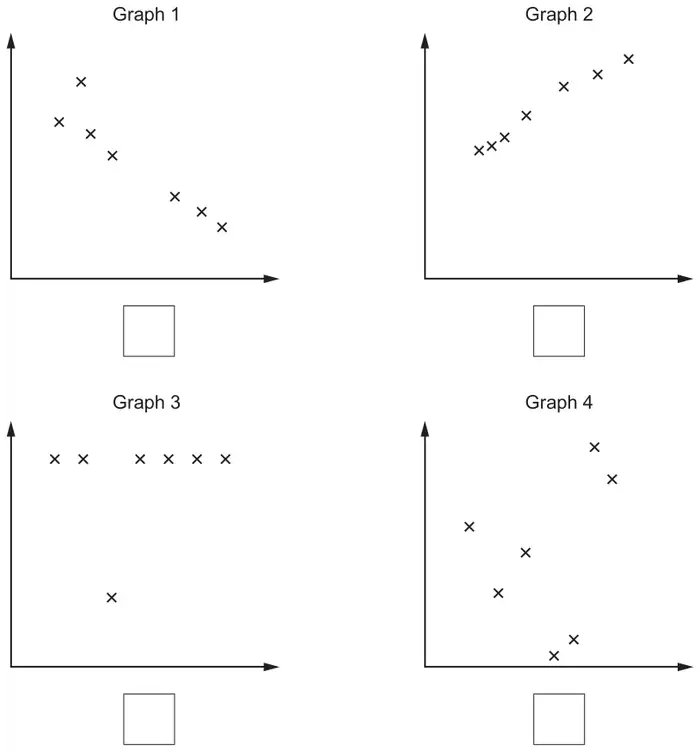
Which scatter diagram would show the relationship between the age and height of a child? Put a tick in the box below the scatter diagram. [1]
(b) 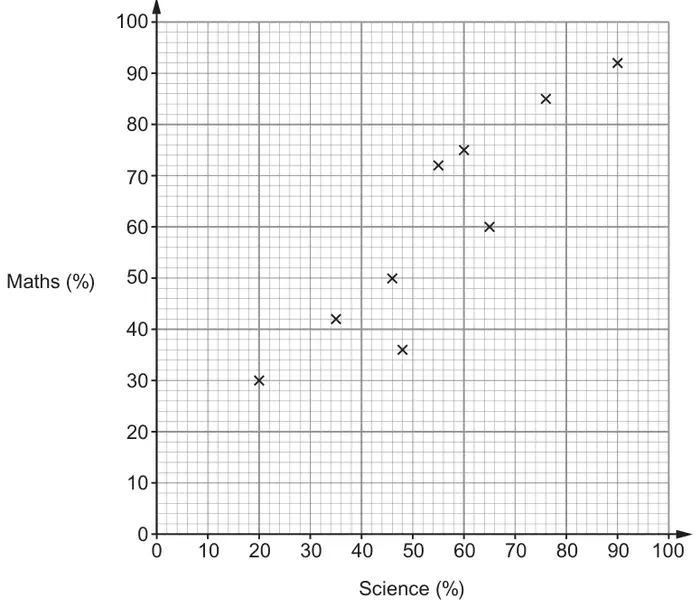
The scatter diagram shows the exam results in maths and science of a class of GCSE students.
(i)
Two students had higher marks in science than they did in maths.
Write down the maths and science marks of these two students. [2]
Student 1 Science mark ……………… Maths mark ………………
Student 2 Science mark ……………… Maths mark ………………
(ii)
One of the students from the class is chosen at random.
Find the probability that this student scored more than 70% in maths. [2]
| Scheme | Marks | Comments |
|---|---|---|
| Graph 2 indicated | B1 |
| Scheme | Marks | Comments |
|---|---|---|
| (i) (Science = ) 48 (%) (Maths = ) 36 (%) (Science = ) 65 (%) (Maths = ) 60 (%) | B2 | B1 for any two correct |
| (ii) \(\dfrac{4}{9}\) ISW | B2 | Award B1 for sight of 4 as a numerator (students scored more than 70%) |
| (5) |