
Foundation June 2019 Paper 1 Q19
19. Cherie is in charge of marketing for a tourist attraction.
(a)
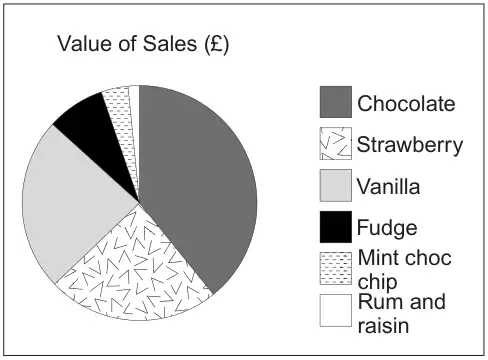
One weekend, she collects some data about the value of ice cream sales from the café.
She records her data in a table and uses it to draw a pie chart.
| Ice cream flavour | Value of sales (£) |
|---|---|
| Chocolate | 500 |
| Strawberry | 300 |
| Coffee | 0 |
| Vanilla | 300 |
| Fudge | 100 |
| Green tea | 0 |
| Mint choc chip | 50 |
| Rum and raisin | 20 |
State one criticism of the use of a pie chart to display her data. [1]
(b)
Cherie also records the number of visitors to the tourist attraction each season for 4 years.
Her results are shown in the table.
| Season | Winter | Spring | Summer | Autumn | |
|---|---|---|---|---|---|
| Visitors (thousands) | 2015 | 9 | 14 | 19 | 13 |
| 2016 | 9 | 13 | 17 | 12 | |
| 2017 | 6 | 11 | 14 | 9 | |
| 2018 | 4 | 8 | 15 | 10 | |
Comment on the trend in the annual number of visitors shown by the data in the table. [1]
| Scheme | Marks | Comments |
|---|---|---|
| Valid comment e.g. ‘Some of the data is lost’ or ‘There are too many categories for a pie chart’ or ‘It does not show coffee and green tea’ | E1 | Allow e.g. ‘It does not show the value of sales’ |
| Scheme | Marks | Comments |
|---|---|---|
| Valid comment e.g. ‘The number of visitors seems to be decreasing’ or ‘The annual number is going down.’ | E1 | Ignore embellishments/superfluous comments about seasons. Allow e.g. ‘From 2015 to 2018 the numbers have decreased.’ |
| (2) |