
Foundation June 2018 Paper 2 Q15
15. Jimmy went for a bike ride.
His journey is represented on the distance time graph below.
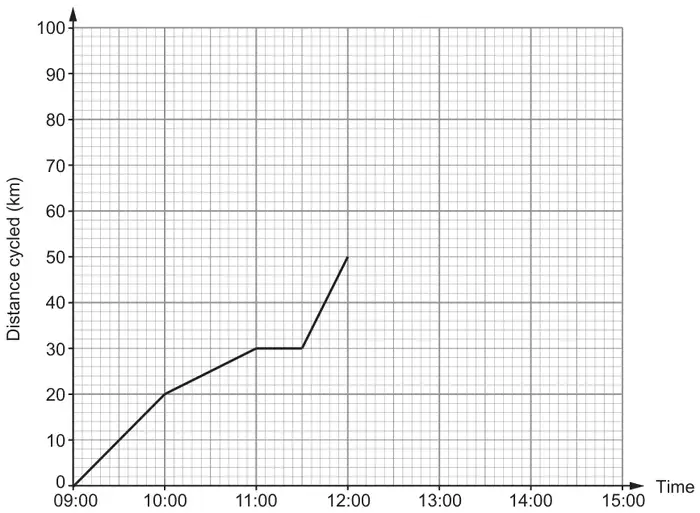
(a) What was Jimmy’s average speed between 09:00 and 11:00? [2]
(b) Give an explanation for the shape of the graph between 11:00 and 11:30. [1]
(c)
(i) Between which times was Jimmy cycling at the greatest speed? [1]
………… and …………
(ii) How can you tell this from the graph? [1]
(d) Between 12:00 and 13:00, Jimmy cycled at a speed of 10 km/h.
At 13:00, he increased his speed so that he had cycled a total of 90 km between 09:00 and 14:00.
Show his journey from 12:00 to 14:00 on the graph. [2]
At 13:00, he increased his speed so that he had cycled a total of 90 km between 09:00 and 14:00.
Show his journey from 12:00 to 14:00 on the graph. [2]
| Scheme | Marks | Comments |
|---|---|---|
| 30÷2 | M1 | |
| = 15 (km/h) | A1 |
| Scheme | Marks | Comments |
|---|---|---|
| Valid description, e.g. ‘stopped’ or equivalent | E1 |
| Scheme | Marks | Comments |
|---|---|---|
| (i) Between 11:30 and 12:00 | B1 | |
| (ii) Explain e.g. ‘the line is steepest’ | E1 |
| Scheme | Marks | Comments |
|---|---|---|
| Joining (12:00,50) to (13:00,60) | B1 | This section may be a straight line or curved. |
| Joining (13:00,60) to (14:00, 90) | B1 | FT ‘their first line’ If no marks, award SC1 for (12:00,50) to (13:00,40) to (14:00, 10) |
| (7) |