
S1 January 2006 Q3
3. A manufacturer stores drums of chemicals. During storage, evaporation takes place. A random sample of 10 drums was taken and the time in storage, \(x\) weeks, and the evaporation loss, \(y\) ml, are shown in the table below.
| \(x\) | 3 | 5 | 6 | 8 | 10 | 12 | 13 | 15 | 16 | 18 |
|---|---|---|---|---|---|---|---|---|---|---|
| \(y\) | 36 | 50 | 53 | 61 | 69 | 79 | 82 | 90 | 88 | 96 |
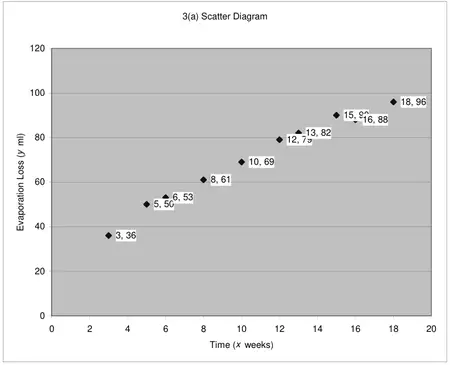
(a) On graph paper, draw a scatter diagram to represent these data. (3)
(b) Give a reason to support fitting a regression model of the form \(y = a + bx\) to these data. (1)
(c) Find, to 2 decimal places, the value of \(a\) and the value of \(b\).
(You may use \(\Sigma x^2 = 1352\), \(\Sigma y^2 = 53\,112\) and \(\Sigma xy = 8354\).)
(7)(d) Give an interpretation of the value of \(b\). (1)
(e) Using your model, predict the amount of evaporation that would take place after
(i) 19 weeks,
(ii) 35 weeks. (2)
(f) Comment, with a reason, on the reliability of each of your predictions. (4)
| Scheme | Marks |
|---|---|
| Sensible graph scales, labels, shape | B1,B1,B1 |
| (3) |
| Scheme | Marks |
|---|---|
| Points lie close to a straight line | B1 |
| (1) |
| Scheme | Marks |
|---|---|
| \(S_{xy} = 8354 - \dfrac{106 \times 704}{10} = 891.6\) | B1 |
| \(S_{xx} = 1352 - \dfrac{106^2}{10} = 228.4\) | B1 |
| \(b = \dfrac{891.6}{228.4} = 3.903677\ldots\) | M1A1 |
| \(a = \dfrac{704}{10} - b\dfrac{106}{10} = 29.021015\ldots\) | M1A1 |
| 29.02, 3.90 | A1ft |
| (7) |
Notes
M1A1 awrt 3.9
M1A1 awrt 29
| Scheme | Marks |
|---|---|
| For every extra week in storage, another 3.90 ml of chemical evaporates | B1 |
| (1) |
| Scheme | Marks |
|---|---|
| (i) 103.12 (ii) 165.52 | B1B1 |
| (2) |
| Scheme | Marks |
|---|---|
| (i) Close to range of \(x\), so reasonably reliable | B1,B1 |
| (ii) Well outside range of \(x\), could be unreliable since no evidence that model will continue to hold | B1 B1 |
| (4) | |
| (18 marks) |