
4MA0 Higher June 2017 Paper 4 Q18
18 The table gives information about the times, in minutes, some people waited in the accident and emergency department at a hospital.
| Time (\(t\) minutes) | Frequency |
|---|---|
| \(0 \lt t \leqslant 30\) | 60 |
| \(30 \lt t \leqslant 90\) | 270 |
| \(90 \lt t \leqslant 120\) | 150 |
| \(120 \lt t \leqslant 240\) | 156 |
| \(240 \lt t \leqslant 300\) | 24 |
On the grid, draw a histogram for this information.
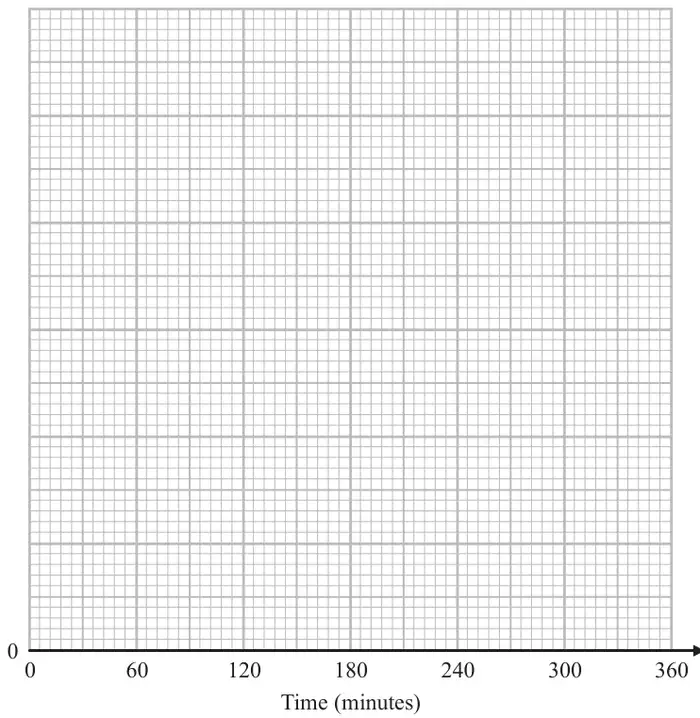
(3)
| Scheme | Marks |
|---|---|
| 60 ÷ 30 (=2) or 270 ÷ 60 (=4.5) or 150 ÷ 30 (=5) or 156 ÷ 120 (=1.3) or 24 ÷ 60 (=0.4) | M1 |
| fd : 2, 4.5, 5, 1.3, 0.4 | M1 |
| histogram | A1 |
| (3) | |
| (3 marks) |
Notes
M1: for use of area
eg. any one correct fd or any 2 correct bars of different widths
M1: for any 4 correct fd or bars
A1: for a correct histogram, including frequency density (FD) label and scale/correct key