
4MA0 Higher June 2017 Paper 4R Q19
19 The table gives information about the time taken by each of 600 people to reach their holiday destination.
| Time taken (\(t\) minutes) | Frequency |
|---|---|
| \(0 \lt t \leqslant 100\) | 120 |
| \(100 \lt t \leqslant 150\) | 140 |
| \(150 \lt t \leqslant 300\) | 240 |
| \(300 \lt t \leqslant 500\) | 80 |
| \(500 \lt t \leqslant 600\) | 20 |
(a) Use the information in the table to complete the histogram. (3)
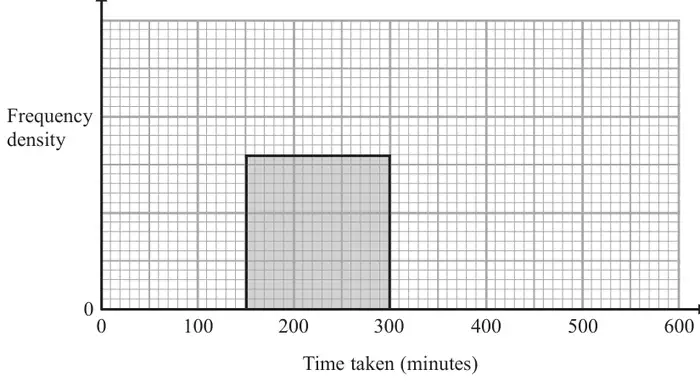
(b) Work out an estimate for the number of people who took more than 200 minutes to reach their holiday destination. (2)
| Scheme | Marks |
|---|---|
| Frequency densities: 1.2, 2.8, 1.6, 0.4, 0.2 | M1 |
| M1 | |
| A fully correct histogram | A1 |
| (3) |
Notes
M1: For 3 or more correctly calculated freq densities or
For a correct scale indicated or
1 small square = 1 (person)
1 big square = 25 (people)
M1: For at least 2 additional correct bars (with or without scale)
Implies first M1
A1: All 4 additional bars correct
| Scheme | Marks |
|---|---|
\(\dfrac{100}{150} \times 240 + 100\) or 1.6 × 100 + 100 or “160” + 100 oe or \(600 - \left(120 + 140 + \dfrac{1}{3} \times 240\right)\) or 600 − (120 + 140 + 50 × 1.6) or 600 − 340 oe | M1 |
| 260 | A1 |
| (2) | |
| (5 marks) |
Notes
M1: A fully complete method to find the number of people who took from 200 to 300 minutes + 100