
4MA0 Higher January 2017 Paper 4 Q20
20 The histogram shows information about the times taken by 160 cyclists to complete the Tour de France cycle race.
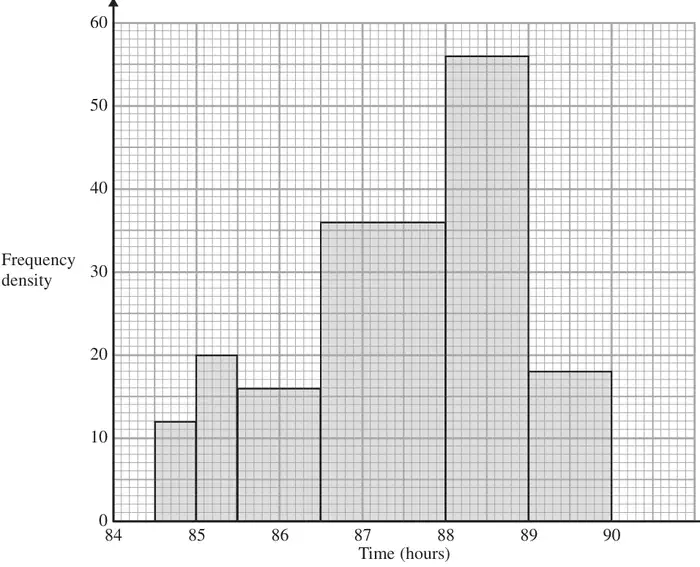
6 cyclists took less than 85 hours.
(a) Work out an estimate for the number of the 160 cyclists who took less than 86 hours. (2)
(b) For these 160 cyclists, work out an estimate for the time taken by the cyclist who finished in 50th position. (2)
| Scheme | Marks |
|---|---|
6 + 10 + 8 or \(12 \times \dfrac{1}{2} + 20 \times \dfrac{1}{2} + 16 \times \dfrac{1}{2}\) or 48 × 0.5 or 60 × 0.1 + 100 × 0.1 + 80 × 0.1 or 240 × 0.1 or 2.4 × 2.5 + 4 × 2.5 + 3.2 × 2.5 or 9.6 × 2.5 | M1 |
| 24 | A1 |
| (2) |
Notes
M1: Or for 1 (small) square = 0.1 or
1 (big) square = 2.5 or
For 6, 10 and 8 marked correctly on the diagram
| Scheme | Marks |
|---|---|
50 − 6 − 10 − 16 or 50 − 32 or \(36 \times \dfrac{1}{2}\) or \(\dfrac{1}{3} \times 54\) or 18 or 180 (small) squares or 180 × 0.1 or 7.2 (big) squares or 7.2 × 2.5 | M1 |
| 87 | A1 |
| (2) | |
| (4 marks) |
Notes
M1: For a vertical line at Time = 87
A1: cao