
4MA0 Higher June 2013 Paper 3R Q15
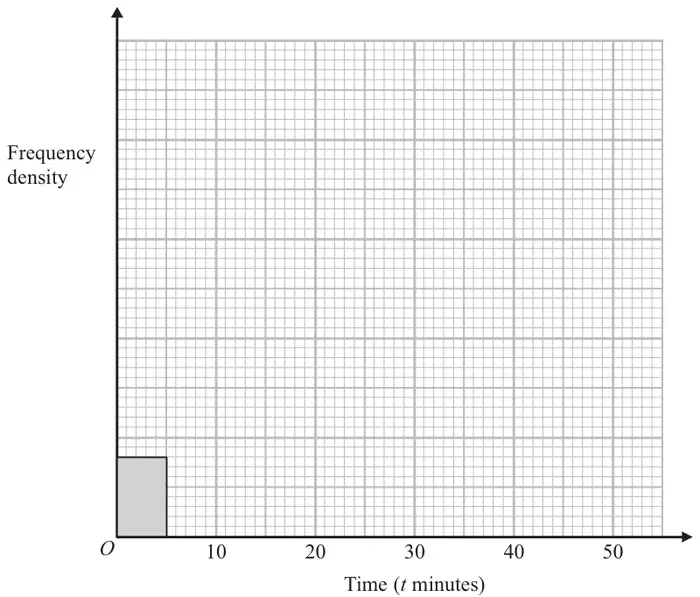
15 The table shows information about the times, in minutes, that some people took to complete a sudoku puzzle.
| Time (\(t\) minutes) | \(0 \lt t \leqslant 5\) | \(5 \lt t \leqslant 20\) | \(20 \lt t \leqslant 30\) | \(30 \lt t \leqslant 50\) |
|---|---|---|---|---|
| Number of people | 4 | 18 | 34 | 30 |
Complete the histogram for this information.
(3)
| Scheme | Marks |
|---|---|
| Blocks at heights 2.4, 6.8, 3 squares | B3 |
| (3) |
Notes
B3: for all 3 blocks correct
(B2 for any 2 blocks correct)
(B1 for any one block correct or for correct frequency density calculated or marked ((0.8), 1.2, 3.4 and 1.5) or 1 square = 2.5 people stated or 1 person = 10 squares)