
4MA0 Higher January 2013 Paper 3 Q13
13 The incomplete table and histogram show information about the lengths of time, \(t\) minutes, students spent waiting for their school bus one morning.
| Time (\(t\) minutes) | Number of students |
|---|---|
| \(0 \lt t \leqslant 2\) | 20 |
| \(2 \lt t \leqslant 10\) | 120 |
| \(10 \lt t \leqslant 15\) | 60 |
| \(15 \lt t \leqslant 20\) | |
| \(20 \lt t \leqslant 30\) | 30 |
(i) Use the histogram to complete the table.
(ii) Use the table to complete the histogram.
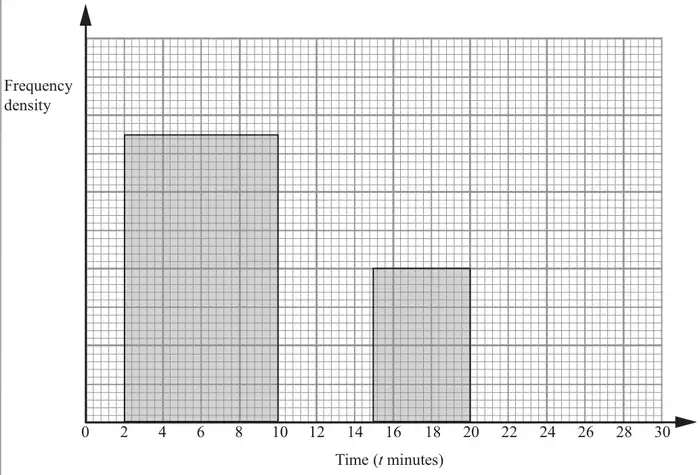
(4)
| Scheme | Marks |
|---|---|
| (i) 5 x 8 | M1 |
| 40 | A1 |
| (ii) Missing blocks = 5cm, 6cm, 1.5cm | B2 |
| (4) |
Notes
M1: Or any correct fd marked on vertical axis (2, 4 etc) with no errors or 1 square = 4 students
B2: 3 correct blocks
If not B2 then B1 for 1 or 2 correct blocks