
4MA0 Higher June 2012 Paper 4 Q17
17 The histogram shows information about the times, \(t\) minutes, patients spent at a doctors’ surgery on one day.
No patient spent more than 40 minutes at the surgery.
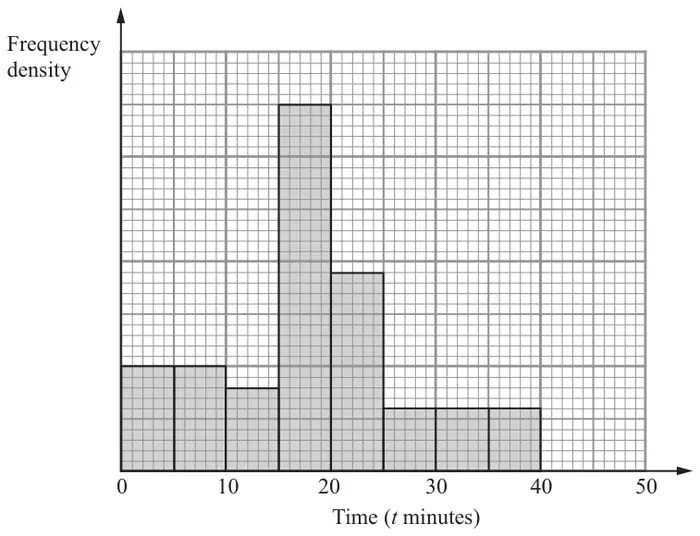
Calculate the total number of patients at the surgery that day. (2)
| Scheme | Marks |
|---|---|
| 3.6 ÷ 20 × 100 oe (large squares or heights of bars) or (6+6+6) ÷ (10+10+8+35+19+6+6+6) × 100 or 90 ÷ 500 × 100 (small squares) | M2 |
| 18 | A1 |
| (3) |
Notes
M2: a full and correct calculation leading to correct ans
heights = 2+2+1.6+7+3.8+1.2+1.2+1.2 (=20)
or 10+10+8+35+19+6+6+6 (=100)
if not M2 then M1 for 3.6 and 20 (large sq or heights)
or 6+6+6 and 10+10+8+35+19+6+6+6 (heights)
or 12+12+12 and 20+20+16+70+38+12+12+12 (frequencies)
or 90 and 500 (small sq)
A1: Ans only = M2A1
Apart from questions 5, 7, 13c, 16b, 20, 21 and 22 (where the mark scheme states otherwise) the correct answer, unless clearly obtained by an incorrect method, should be taken to imply a correct method.
| Scheme | Marks |
|---|---|
| 20 × 10 | M1 |
| 200 | A1 |
| (2) | |
| (Total 5 marks) |
Notes
M1: or 1 (large) square = 10 (people)
or 1 (small) square = 0.4 (people)
or correct fd seen with no errors
or 16 ÷ 5 (= 3.2) {fd on 3rd bar}
or 20+20+16+70+38+12+12+12 (people in blocks)
A1: Ans only = M1A1