
4MA0 Higher June 2013 Paper 4 Q18
18 The histogram shows information about the times, \(t\) hours, for which some cars were left in a car park.
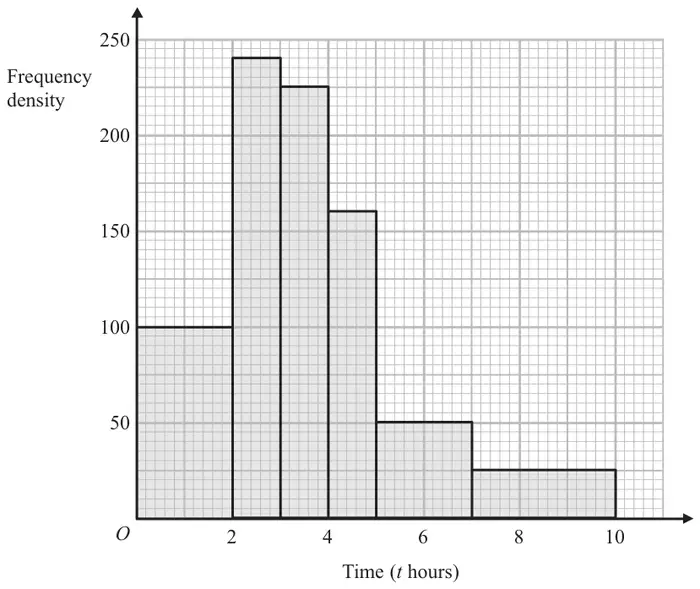
Calculate an estimate for the number of cars which were left in the car park for between 4.5 hours and 8 hours.
(3)
| Scheme | Marks |
|---|---|
| (0.5 x 160), (2 x 50), (1 x 25) | M1 |
| 80 + 100 + 25 | M1 |
| 205 | A1 |
| (3) |
Notes
M1: for any two or a clear indication that 1 car = 1 small sq or 25 cars = 1 cm2
M1: or 8.2 x 25 oe