
4MA0 Higher January 2016 Paper 4R Q18
18 The incomplete histogram and the incomplete table show information about the ages of people watching a film in a cinema.
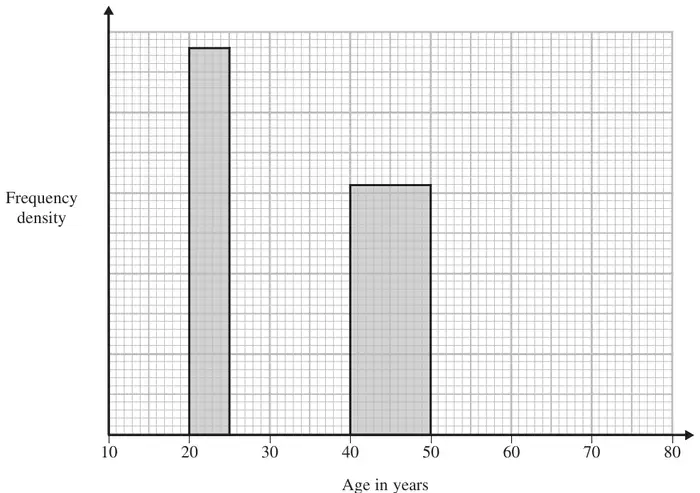
| Age (\(a\) years) | Number of people |
|---|---|
| \(10 \leqslant a \lt 20\) | 38 |
| \(20 \leqslant a \lt 25\) | 24 |
| \(25 \leqslant a \lt 40\) | 63 |
| \(40 \leqslant a \lt 50\) | |
| \(50 \leqslant a \lt 80\) | 24 |
(a) Use the histogram to complete the table. (2)
(b) Use the table to complete the histogram. (2)
| Scheme | Marks |
|---|---|
| 1cm × 1cm square = 2.5 people or 1 large square = 10 people or 4.8 on axis corresponding to top of 20-25 bar or Correct scale marked on vertical axis or 10 small squares = 1 person oe | M1 |
| 31 | A1 |
| (2) |
| Scheme | Marks |
|---|---|
| Freq densities: 38/10 (= 3.8), 63/15 (= 4.2), 24/30 (= 0.8) | M1 |
| A1 | |
| (2) |
Notes
M1: 2 correct frequency densities or
1 of the 3 bars correctly drawn
A1: All 3 bars correctly drawn