
4MA0 Higher June 2016 Paper 3R Q16
16 The incomplete histogram shows information about the heights of a group of children.
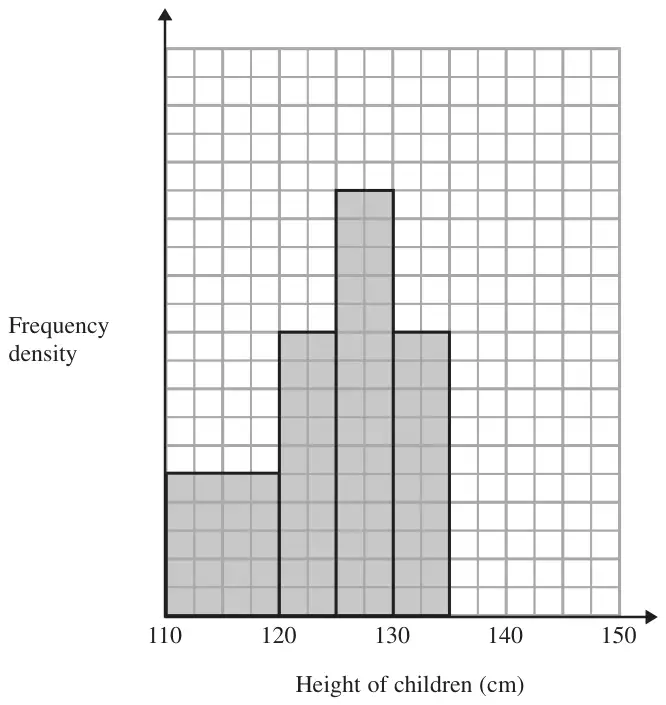
There were 10 children with heights between 130 cm and 135 cm.
(a) How many children had heights between 110 cm and 130 cm? (3)
There were 6 children with heights between 135 cm and 145 cm.
(b) Show this information on the histogram. (1)
| Scheme | Marks |
|---|---|
1 Square = 0.5 or 2 squares = 1 oe Or fd \(\left(\dfrac{10}{5} = 2\right)\) calculated or marked at correct place on vertical axis with no contradictions | M1 |
| 1 × 10 + 2 × 5 + 3 × 5 (=10 + 10 + 15) oe | M1 |
| 35 | A1 |
| (3) |
Notes
M1: 1 Square = 0.5 or 2 squares = 1
Or correct fd \(\left(\dfrac{10}{5} = 2\right)\) calculated or marked on the vertical axis with no contradictions
M1: Complete method to find total number of children, eg 10, 10, and 15 frequencies assigned to correct blocks
| Scheme | Marks |
|---|---|
| Correct block | B1 |
| (1) |