
4MA0 Higher June 2015 Paper 3 Q19
19 The table gives information about the areas of some farms in France.
| Area (\(A\) hectares) | Frequency |
|---|---|
| \(0 \lt A \leqslant 20\) | 50 |
| \(20 \lt A \leqslant 50\) | 90 |
| \(50 \lt A \leqslant 100\) | 120 |
| \(100 \lt A \leqslant 300\) | 160 |
On the grid, draw a histogram to show this information.
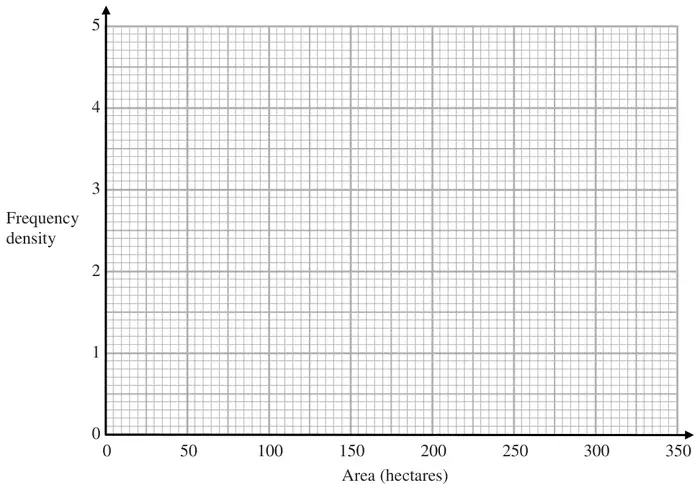
(3)
| Scheme | Marks |
|---|---|
| Any 2 of 50 ÷ 20 (= 2.5), 90 ÷ 30 (= 3), 120 ÷ 50 (= 2.4), 160 ÷ 200 (= 0.8) | M1 |
| Any 3 of 2.5, 3, 2.4, 0.8 | A1 |
Correct histogram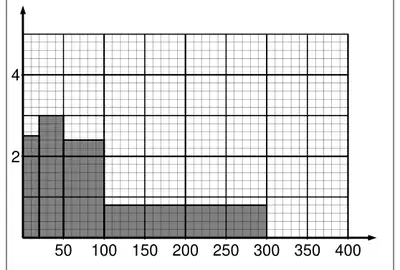 | A1 |
| (3) |
Notes
M1: for any two correct fd calculations can be implied by any two correct frequency densities or any two correct bars
A1: for any 3 FDs correct
(can be implied by at least 3 correct bars)
A1: for a fully correct histogram
SC : B2 All four bars of correct width with heights in the correct ratio
(B1 for 3 bars of correct width with heights in the correct ratio)