
4MA0 Foundation June 2015 Paper 1 Q8
8 The bar chart gives information about the numbers of students in the 4 classes of Year 11 in a school.
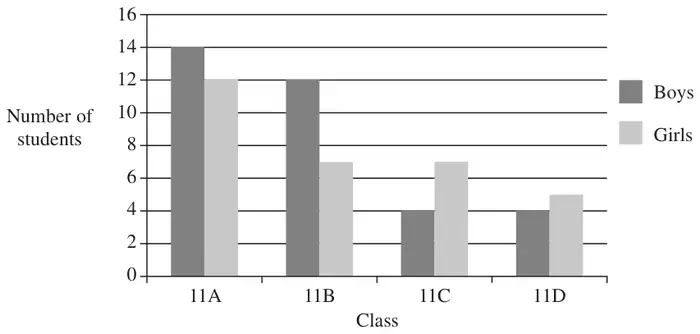
(a) Write down the number of boys in class 11A. (1)
There are more girls in class 11C than there are girls in class 11D.
(b) How many more? (1)
(c) Work out the total number of students in Year 11 (2)
(d) Work out what percentage of Year 11 students are in class 11A. (2)
| Scheme | Marks |
|---|---|
| 14 | B1 |
| (1) |
| Scheme | Marks |
|---|---|
| 2 | B1 |
| (1) |
| Scheme | Marks |
|---|---|
| 26 + 19 + 11 + 9 (at least 3 correct) or 14 + 12 + 12 + 7 + 4 + 7 + 4 + 5 (at least 6 correct) | M1 |
| 65 | A1 |
| (2) |
| Scheme | Marks |
|---|---|
| \(\dfrac{26}{\text{“}65\text{”}} \times 100\) oe | M1 |
| 40 | A1 |
| (2) | |
| Total 6 marks |
Notes
M1: ft from (a)
A1: ft from (c) provided working seen (at least 2 sig figs)