
4MA0 Foundation June 2015 Paper 2 Q6
6 The pictogram shows information about the number of cans of cola sold in a shop on each of six days.
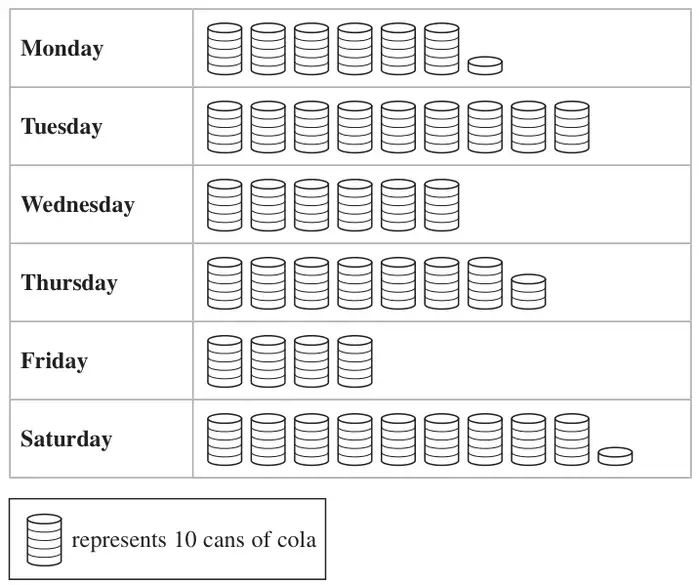
(a) On which day was the greatest number of cans of cola sold? (1)
(b) How many cans of cola were sold on Friday? (1)
(c) How many cans of cola were sold on Thursday? (1)
(d) On which day were 62 cans of cola sold? (1)
(e) Find the ratio of the number of cans of cola sold on Tuesday to the number of cans of cola sold on Wednesday.
Give your ratio in its simplest form. (2)
Give your ratio in its simplest form. (2)
| Scheme | Marks |
|---|---|
| Saturday | B1 |
| (1) |
Notes
B1: accept Sat
| Scheme | Marks |
|---|---|
| 40 | B1 |
| (1) |
| Scheme | Marks |
|---|---|
| 76 | B1 |
| (1) |
| Scheme | Marks |
|---|---|
| Monday | B1 |
| (1) |
Notes
B1: accept Mon
| Scheme | Marks |
|---|---|
| 90 : 60 or 9 : 6 | M1 |
| 3 : 2 | A1 |
| (2) | |
| Total 6 marks |
Notes
M1: or any ratio equivalent to 3 : 2 or a final answer of 2 : 3
A1: Allow 1.5 : 1 or 1 : \(\dfrac{2}{3}\)