
4MA0 Foundation January 2016 Paper 2 Q3
3 The pictogram shows information about the number of books sold in a shop on each of six days.
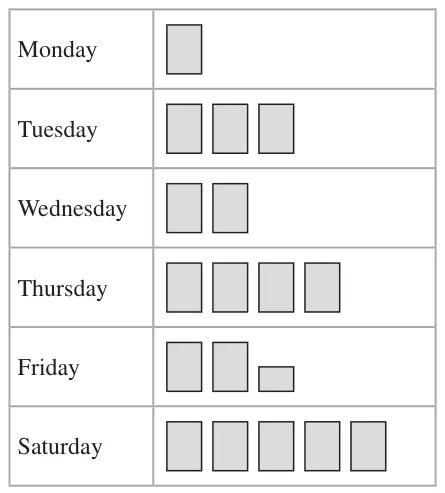
(a) On which day was the least number of books sold in the shop? (1)
The number of books sold in the shop on one of these days was twice the number of books sold on Wednesday.
(b) On which day was this? (1)
The number of books sold in the shop on Tuesday was 18
(c) Work out the number of books sold in the shop on Friday. (2)
| Scheme | Marks |
|---|---|
| Monday | B1 |
| (1) |
| Scheme | Marks |
|---|---|
| Thursday | B1 |
| (1) |
| Scheme | Marks |
|---|---|
| \(\dfrac{18}{3} \times 2.5\) or 6 × 2.5 or \(\dfrac{18}{3}\) or 6 | M1 |
| 15 | A1 |
| (2) |
Notes
M1: Finding 1 rectangle = 6 (books) or \(\dfrac{18}{3}\) or a correct calculation to find the number of books sold on Friday