
C4 June 2016 Q2
2.
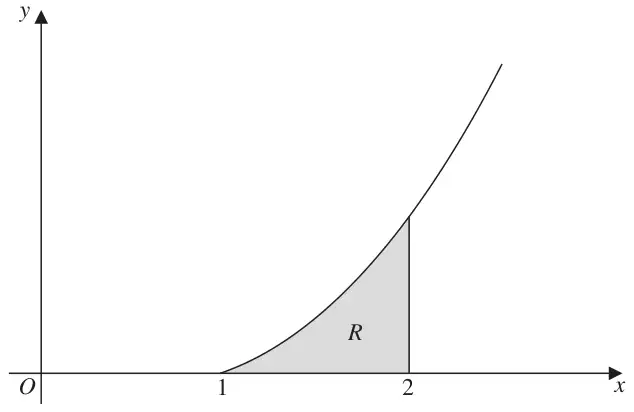
Figure 1 shows a sketch of part of the curve with equation \(y = x^2\ln x,\ x \geqslant 1\)
The finite region \(R\), shown shaded in Figure 1, is bounded by the curve, the \(x\)-axis and the line \(x = 2\)
The table below shows corresponding values of \(x\) and \(y\) for \(y = x^2\ln x\)
| \(x\) | 1 | 1.2 | 1.4 | 1.6 | 1.8 | 2 |
|---|---|---|---|---|---|---|
| \(y\) | 0 | 0.2625 | 1.2032 | 1.9044 | 2.7726 |
| Scheme | Marks | ||||||||||||||
|---|---|---|---|---|---|---|---|---|---|---|---|---|---|---|---|
| |||||||||||||||
| \(\{\text{At } x = 1.4,\}\ y = 0.6595\) (4 dp) 0.6595 | B1 cao | ||||||||||||||
| (1) |
Notes
B1: 0.6595 correct answer only. Look for this on the table or in the candidate’s working.
| Scheme | Marks |
|---|---|
| \(\dfrac{1}{2} \times (0.2) \times \Big[0 + 2.7726 + 2\big(0.2625 + \text{their } 0.6595 + 1.2032 + 1.9044\big)\Big]\) {Note: The “0” does not have to be included in [……]} Outside brackets \(\dfrac{1}{2} \times (0.2)\) or \(\dfrac{1}{10}\) For structure of \(\big[\ldots\ldots\ldots\ldots\big]\) | B1 o.e. M1 |
| \(\left\{= \dfrac{1}{10}(10.8318)\right\} = 1.08318 = 1.083\) (3 dp) anything that rounds to 1.083 | A1 |
| (3) |
Notes
B1: Outside brackets \(\dfrac{1}{2} \times (0.2)\) or \(\dfrac{1}{2} \times \dfrac{1}{5}\) or \(\dfrac{1}{10}\) or equivalent.
M1: For structure of trapezium rule \(\big[\ldots\ldots\ldots\ldots\big]\)
Note: No errors are allowed [eg. an omission of a \(y\)-ordinate or an extra \(y\)-ordinate or a repeated \(y\) ordinate].
A1: anything that rounds to 1.083
Note: Working must be seen to demonstrate the use of the trapezium rule. (Actual area is 1.070614704…)
Note: Full marks can be gained in part (b) for using an incorrect part (a) answer of 0.6594
Note: Award B1M1A1 for \(\dfrac{1}{10}(2.7726) + \dfrac{1}{5}(0.2625 + \text{their } 0.6595 + 1.2032 + 1.9044)\) = awrt 1.083
Bracketing mistake: Unless the final answer implies that the calculation has been done correctly
Award B1M0A0 for \(\dfrac{1}{2}(0.2) + 2(0.2625 + \text{their } 0.6595 + 1.2032 + 1.9044) + 2.7726\) (answer of 10.9318)
Award B1M0A0 for \(\dfrac{1}{2}(0.2)(2.7726) + 2(0.2625 + \text{their } 0.6595 + 1.2032 + 1.9044)\) (answer of 8.33646)
Alternative method: Adding individual trapezia
Area \(\approx 0.2 \times \left[\dfrac{0 + 0.2625}{2} + \dfrac{0.2625 + \text{"}0.6595\text{"}}{2} + \dfrac{\text{"}0.6595\text{"} + 1.2032}{2} + \dfrac{1.2032 + 1.9044}{2} + \dfrac{1.9044 + 2.7726}{2}\right] = 1.08318\ldots\)
B1: 0.2 and a divisor of 2 on all terms inside brackets
M1: First and last ordinates once and two of the middle ordinates inside brackets ignoring the 2
A1: anything that rounds to 1.083
| Scheme | Marks |
|---|---|
| Way 1 | |
| \(\left\{\text{I} = \displaystyle\int x^2\ln x\,\mathrm{d}x\right\},\ \left\{\begin{aligned} u &= \ln x \Rightarrow \dfrac{\mathrm{d}u}{\mathrm{d}x} = \dfrac{1}{x} \\ \dfrac{\mathrm{d}v}{\mathrm{d}x} &= x^2 \Rightarrow v = \dfrac{1}{3}x^3 \end{aligned}\right\}\) | |
| \(= \dfrac{x^3}{3}\ln x - \displaystyle\int \dfrac{x^3}{3}\left(\dfrac{1}{x}\right)\{\mathrm{d}x\}\) Either \(x^2\ln x \to \pm\lambda x^3\ln x - \displaystyle\int \mu x^3\left(\dfrac{1}{x}\right)\{\mathrm{d}x\}\) or \(\pm\lambda x^3\ln x - \displaystyle\int \mu x^2\{\mathrm{d}x\}\), where \(\lambda, \mu > 0\) \(x^2\ln x \to \dfrac{x^3}{3}\ln x - \displaystyle\int \dfrac{x^3}{3}\left(\dfrac{1}{x}\right)\{\mathrm{d}x\}\), simplified or un-simplified | M1 A1 |
| \(= \dfrac{x^3}{3}\ln x - \dfrac{x^3}{9}\) \(\dfrac{x^3}{3}\ln x - \dfrac{x^3}{9}\), simplified or un-simplified | A1 |
| \(\text{Area}(R) = \left\{\left[\dfrac{x^3}{3}\ln x - \dfrac{x^3}{9}\right]_1^2\right\} = \left(\dfrac{8}{3}\ln 2 - \dfrac{8}{9}\right) - \left(0 - \dfrac{1}{9}\right)\) dependent on the previous M mark. Applies limits of 2 and 1 and subtracts the correct way round | dM1 |
| \(= \dfrac{8}{3}\ln 2 - \dfrac{7}{9}\) \(\dfrac{8}{3}\ln 2 - \dfrac{7}{9}\) or \(\dfrac{1}{9}(24\ln 2 - 7)\) | A1 oe cso |
| (5) | |
| Way 2 | |
| \(\text{I} = x^2(x\ln x - x) - \displaystyle\int 2x(x\ln x - x)\,\mathrm{d}x\), \(\left\{\begin{aligned} u &= x^2 \Rightarrow \dfrac{\mathrm{d}u}{\mathrm{d}x} = 2x \\ \dfrac{\mathrm{d}v}{\mathrm{d}x} &= \ln x \Rightarrow v = x\ln x - x \end{aligned}\right\}\) | |
| So, \(3\text{I} = x^2(x\ln x - x) + \displaystyle\int 2x^2\{\mathrm{d}x\}\) | |
| and \(\text{I} = \dfrac{1}{3}x^2(x\ln x - x) + \dfrac{1}{3}\displaystyle\int 2x^2\{\mathrm{d}x\}\) A full method of applying \(u = x^2,\ v' = \ln x\) to give \(\pm\lambda x^2(x\ln x - x) \pm \mu\displaystyle\int x^2\{\mathrm{d}x\}\) \(\dfrac{1}{3}x^2(x\ln x - x) + \dfrac{1}{3}\displaystyle\int 2x^2\{\mathrm{d}x\}\), simplified or un-simplified | M1 A1 |
| \(= \dfrac{1}{3}x^2(x\ln x - x) + \dfrac{2}{9}x^3\) \(\dfrac{x^3}{3}\ln x - \dfrac{x^3}{9}\), simplified or un-simplified | A1 |
| Then award dM1A1 in the same way as above | M1 A1 |
| (5) | |
| (9 marks) |
Notes
A1: Exact answer needs to be a two term expression in the form \(a\ln b + c\)
Note: Give A1 e.g. \(\dfrac{8}{3}\ln 2 - \dfrac{7}{9}\) or \(\dfrac{1}{9}(24\ln 2 - 7)\) or \(\dfrac{4}{3}\ln 4 - \dfrac{7}{9}\) or \(\dfrac{1}{3}\ln 256 - \dfrac{7}{9}\) or \(-\dfrac{7}{9} + \dfrac{8}{3}\ln 2\) or \(\ln 2^{\frac{8}{3}} - \dfrac{7}{9}\) or equivalent.
Note: Give final A0 for a final answer of \(\dfrac{8\ln 2 - \ln 1}{3} - \dfrac{7}{9}\) or \(\dfrac{8\ln 2}{3} - \dfrac{1}{3}\ln 1 - \dfrac{7}{9}\) or \(\dfrac{8\ln 2}{3} - \dfrac{8}{9} + \dfrac{1}{9}\) or \(\dfrac{8}{3}\ln 2 - \dfrac{7}{9} + c\)
Note: \(\left[\dfrac{x^3}{3}\ln x - \dfrac{x^3}{9}\right]_1^2\) followed by awrt 1.07 with no correct answer seen is dM1A0
Note: Give dM0A0 for \(\left[\dfrac{x^3}{3}\ln x - \dfrac{x^3}{9}\right]_1^2 \to \left(\dfrac{8}{3}\ln 2 - \dfrac{8}{9}\right) - \dfrac{1}{9}\) (adding rather than subtracting)
Note: Allow dM1A0 for \(\left[\dfrac{x^3}{3}\ln x - \dfrac{x^3}{9}\right]_1^2 \to \left(\dfrac{8}{3}\ln 2 - \dfrac{8}{9}\right) - \left(0 + \dfrac{1}{9}\right)\)
SC: A candidate who uses \(u = \ln x\) and \(\dfrac{\mathrm{d}v}{\mathrm{d}x} = x^2\), \(\dfrac{\mathrm{d}u}{\mathrm{d}x} = \dfrac{\alpha}{x}\), \(v = \beta x^3\), writes down the correct “by parts” formula but makes only one error when applying it can be awarded Special Case 1st M1.