
C3 June 2017 Q8
8.
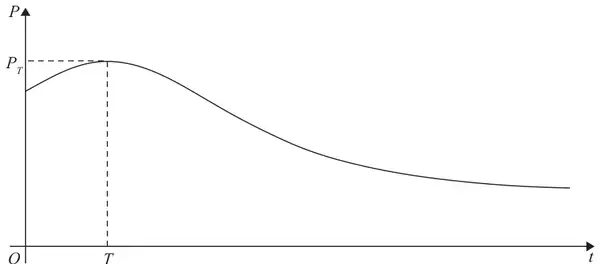
The number of rabbits on an island is modelled by the equation\[P = \frac{100\mathrm{e}^{-0.1t}}{1 + 3\mathrm{e}^{-0.9t}} + 40, \qquad t \in \mathbb{R}, t \geqslant 0\]where \(P\) is the number of rabbits, \(t\) years after they were introduced onto the island.
A sketch of the graph of \(P\) against \(t\) is shown in Figure 3.
The number of rabbits initially increases, reaching a maximum value \(P_T\) when \(t = T\)
(Solutions based entirely on graphical or numerical methods are not acceptable.)
(4)For \(t > T\), the number of rabbits decreases, as shown in Figure 3, but never falls below \(k\), where \(k\) is a positive constant.
| Scheme | Marks |
|---|---|
| \(P_0 = \dfrac{100}{1 + 3} + 40 = 65\) | B1 |
| (1) |
Notes
B1: \((P_0 =)65\)
| Scheme | Marks |
|---|---|
| \(\dfrac{\mathrm{d}}{\mathrm{d}t}\mathrm{e}^{kt} = C\mathrm{e}^{kt}\) | M1 |
| \(\dfrac{\mathrm{d}P}{\mathrm{d}t} = \dfrac{\left(1 + 3\mathrm{e}^{-0.9t}\right) \times -10\mathrm{e}^{-0.1t} - 100\mathrm{e}^{-0.1t} \times -2.7\mathrm{e}^{-0.9t}}{\left(1 + 3\mathrm{e}^{-0.9t}\right)^2}\) | M1 A1 |
| (3) |
Notes
M1: For sight of \(\dfrac{\mathrm{d}}{\mathrm{d}t}\mathrm{e}^{kt} = C\mathrm{e}^{kt}\) (Allow \(C\) =1)This may be within an incorrect product or quotient rule
M1: Scored for a full application of the quotient rule. If the formula is quoted it should be correct.
The denominator should be present even when the correct formula has been quoted.
In cases where a formula has not been quoted it is very difficult to judge that a correct formula has been used (due to the signs between the terms). So…………
if the formula has not been quoted look for the order of the terms \(\dfrac{(1 + 3\mathrm{e}^{-0.9t}) \times p\mathrm{e}^{-0.1t} - q\mathrm{e}^{-0.1t} \times \mathrm{e}^{-0.9t}}{(1 + 3\mathrm{e}^{-0.9t})^2}\) \(\dfrac{(1 + 3\mathrm{e}^{-0.9t}) \times p\mathrm{e}^{-0.1t} + q\mathrm{e}^{-0.1t} \times \mathrm{e}^{-0.9t}}{(1 + 3\mathrm{e}^{-0.9t})^2}\)
For the product rule. Look for \(a\mathrm{e}^{-0.1t}\left(1 + 3\mathrm{e}^{-0.9t}\right)^{-1} \pm b\mathrm{e}^{-0.1t}\mathrm{e}^{-0.9t}\left(1 + 3\mathrm{e}^{-0.9t}\right)^{-2}\) either way around
Penalise if an incorrect formula is quoted . Condone missing brackets in both cases.
A1: A correct unsimplified answer.
Eg using quotient rule \(\left(\dfrac{\mathrm{d}P}{\mathrm{d}t}\right) = \dfrac{-10\mathrm{e}^{-0.1t}\left(1 + 3\mathrm{e}^{-0.9t}\right) + 270\mathrm{e}^{-0.1t}\mathrm{e}^{-0.9t}}{\left(1 + 3\mathrm{e}^{-0.9t}\right)^2}\) oe \(\dfrac{-10\mathrm{e}^{-0.1t} + 240\mathrm{e}^{-1t}}{\left(1 + 3\mathrm{e}^{-0.9t}\right)^2}\) simplified
Eg using product rule \(\left(\dfrac{\mathrm{d}P}{\mathrm{d}t}\right) = -10\mathrm{e}^{-0.1t}\left(1 + 3\mathrm{e}^{-0.9t}\right)^{-1} + 270\mathrm{e}^{-0.1t}\mathrm{e}^{-0.9t}\left(1 + 3\mathrm{e}^{-0.9t}\right)^{-2}\) oe
Remember to isw after a correct (unsimplified) answer.
There is no need to have the \(\dfrac{\mathrm{d}P}{\mathrm{d}t}\) and it could be called \(\dfrac{\mathrm{d}y}{\mathrm{d}x}\)
(c)(i)
| Scheme | Marks |
|---|---|
| At maximum \(\quad -10\mathrm{e}^{-0.1t} - 30\mathrm{e}^{-0.1t} \times \mathrm{e}^{-0.9t} + 270\mathrm{e}^{-0.1t} \times \mathrm{e}^{-0.9t} = 0\) \(\mathrm{e}^{-0.1t}\left(-10 + 240\mathrm{e}^{-0.9t}\right) = 0\) | |
| \(\mathrm{e}^{-0.9t} = \dfrac{10}{240} \qquad \text{oe } \mathrm{e}^{0.9t} = 24\) | M1 |
| \(-0.9t = \ln\left(\dfrac{1}{24}\right) \Rightarrow t = \dfrac{10}{9}\ln(24) = 3.53\) | M1, A1 |
(c)(ii)
| Scheme | Marks |
|---|---|
| Sub \(t = 3.53 \Rightarrow P_T = 102\) | A1 |
| (4) |
Notes
(c)(i) Do NOT allow any marks in here without sight/implication of \(\dfrac{\mathrm{d}P}{\mathrm{d}t} = 0, \dfrac{\mathrm{d}P}{\mathrm{d}t} < 0\) OR \(\dfrac{\mathrm{d}P}{\mathrm{d}t} > 0\)
The question requires the candidate to find \(t\) using part (b) so it is possible to do this part using inequalities using the same criteria as we apply for the equality. All marks in (c) can be scored from an incorrect denominator (most likely \(v\) ), no denominator, or using a numerator the wrong way around ie \(uv' - u'v\)
M1: Sets their \(\dfrac{\mathrm{d}P}{\mathrm{d}t} = 0\) or the numerator of their \(\dfrac{\mathrm{d}P}{\mathrm{d}t} = 0\), factorises out or cancels a term in \(\mathrm{e}^{-0.1t}\) to reach a form \(A\mathrm{e}^{\pm 0.9t} = B\) oe. Alternatively they could combine terms to reach \(A\mathrm{e}^{-t} = B\mathrm{e}^{-0.1t}\) or equivalent
Condone a double error on \(\mathrm{e}^{-0.1t} \times \mathrm{e}^{-0.9t} = \mathrm{e}^{-0.1t \times -0.9t}\) or similar before factorising. Look for correct indices.
If they use the product rule then expect to see their \(\dfrac{\mathrm{d}P}{\mathrm{d}t} = 0\) followed by multiplication of \(\left(1 + 3\mathrm{e}^{-0.9t}\right)^2\) before similar work to the quotient rule leads to a form \(A\mathrm{e}^{\pm 0.9t} = B\)
M1: Having set the numerator of their \(\dfrac{\mathrm{d}P}{\mathrm{d}t} = 0\) and obtained either \(\mathrm{e}^{\pm kt} = C\) (\(k\) may be incorrect) or \(A\mathrm{e}^{-t} = B\mathrm{e}^{-0.1t}\) it is awarded for the correct order of operations, taking ln's leading to \(t = ..\)
It cannot be awarded from impossible equations Eg \(\mathrm{e}^{\pm 0.9t} = -0.3\)
A1: cso \(t = \text{awrt } 3.53\) Accept \(t = \dfrac{10}{9}\ln(24)\) or exact equivalent.
(c)(ii)
A1: awrt 102 following 3.53 The M's must have been awarded. This is not a B mark.
| Scheme | Marks |
|---|---|
| 40 | B1 |
| (1) | |
| (9 marks) |
Notes
B1: Sight of 40
Condone statements such as \(P \to 40\) \(k \geqslant 40\) or likewise