
C3 June 2014 Q4
4.
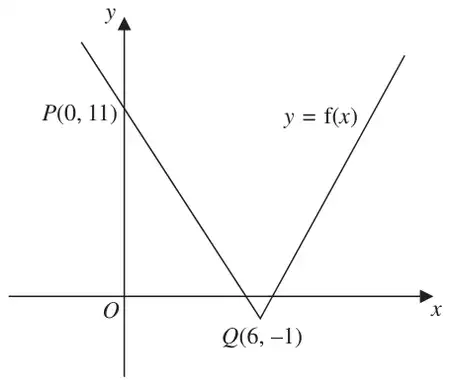
Figure 1 shows part of the graph with equation \(y=\mathrm{f}(x)\), \(x\in\mathbb{R}\).
The graph consists of two line segments that meet at the point \(Q(6,-1)\).
The graph crosses the \(y\)-axis at the point \(P(0,11)\).
Sketch, on separate diagrams, the graphs of
On each diagram, show the coordinates of the points corresponding to \(P\) and \(Q\).
Given that \(\mathrm{f}(x)=a|x-b|-1\), where \(a\) and \(b\) are constants,
| Scheme | Marks |
|---|---|
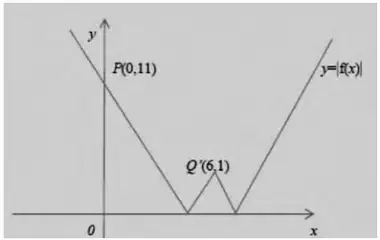
| ‘W’ Shape | B1 |
| \((0,11)\) and \((6,1)\) | B1 |
| (2) |
Notes
B1 A W shape in any position. The arms of the W do not need to be symmetrical but the two bottom points must appear to be at the same height. Do not accept rounded W’s.
A correct sketch of \(y=\mathrm{f}\left(|x|\right)\) would score this mark.
B1 A W shape in quadrants 1 and 2 sitting on the \(x\) axis with \(P'=(0,11)\) and \(Q'=(6,1)\). It is not necessary to see them labelled. Accept 11 being marked on the \(y\) axis for \(P'\). Condone \(P'=(11,0)\) marked on the correct axis, but \(Q'=(1,6)\) is B0
| Scheme | Marks |
|---|---|
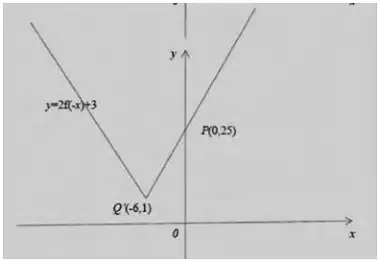
| ‘V’ shape | B1 |
| \((-6,1)\) | B1 |
| \((0,25)\) | B1 |
| (3) |
Notes
B1 Score for a V shape in any position on the grid. The arms of the V do not need to be symmetrical. Do not accept rounded or upside down V’s for this mark.
B1 \(Q'=(-6,1)\). It does not need to be labelled but it must correspond to the minimum point on the curve and be in the correct quadrant.
B1 \(P'=(0,25)\). It does not need to be labelled but it must correspond to the y intercept and the line must cross the axis. Accept 25 marked on the correct axis. Condone \(P'=(25,0)\) marked on the positive \(y\) axis.
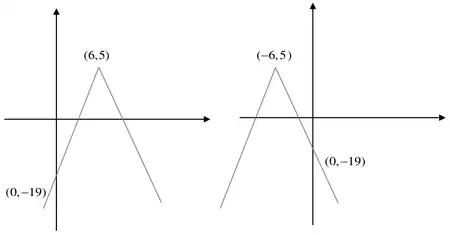
Special case: A candidate who mistakenly sketches \(y=-2\mathrm{f}(x)+3\) or \(y=-2\mathrm{f}(-x)+3\) will arrive at one of the following. They can be awarded SC B1B0B0
| Scheme | Marks |
|---|---|
| One of \(a=2\) or \(b=6\) | B1 |
| \(a=2\) and \(b=6\) | B1 |
| (2) | |
| (7 marks) |
Notes
B1 Either states \(a=2\) or \(b=6\).
This can be implied (if there are no stated answers given) by the candidate writing that \(y=..|x-6|-1\) or \(y=2|x-..|-1\). If they are both stated and written, the stated answer takes precedence.
B1 States both \(a=2\) and \(b=6\)
This can be implied by the candidate stating that \(y=2|x-6|-1\)
If they are both stated and written, the stated answer takes precedence.