
C3 June 2013 (R) Q8
8.
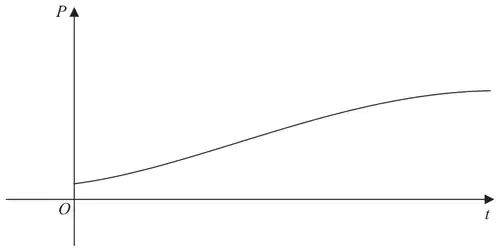
The population of a town is being studied. The population \(P\), at time \(t\) years from the start of the study, is assumed to be\[P=\frac{8000}{1+7\mathrm{e}^{-kt}},\qquad t\geqslant 0,\]where \(k\) is a positive constant.
The graph of \(P\) against \(t\) is shown in Figure 3.
Use the given equation to
Given also that the population reaches 2500 at 3 years from the start of the study,
Using this value for \(k\),
| Scheme | Marks |
|---|---|
| \(t=0\Rightarrow P=\dfrac{8000}{1+7}=1000\) cao | M1A1 |
| (2) |
Notes
M1 Sets \(t=0\), giving \(e^{-k\times 0}=1\). Award if candidate attempts \(\dfrac{8000}{1+7\times 1},\dfrac{8000}{8}\)
A1 Correct answer only 1000. Accept 1000 for both marks as long as no incorrect working is seen.
| Scheme | Marks |
|---|---|
| \(t\to\infty\quad P\to\dfrac{8000}{1}=8000\) | B1 |
| (1) |
Notes
B1 8000. Accept \(P<8000\). Condone \(P\leqslant 8000\) but not \(P>8000\)
| Scheme | Marks |
|---|---|
| \(t=3,\ P=2500\Rightarrow 2500=\dfrac{8000}{1+7e^{-3k}}\) | B1 |
| \(e^{-3k}=\dfrac{2.2}{7}=(0.31..)\) oe | M1,A1 |
| \(k=-\dfrac{1}{3}\ln\left(\dfrac{2.2}{7}\right)=\text{awrt }0.386\) | M1A1 |
| (5) |
Notes
B1 Sets both \(t=3\), and \(P=2500\Rightarrow 2500=\dfrac{8000}{1+7e^{-3k}}\)
This may be implied by a subsequent correct line.
M1 Rearranges the equation to make \(e^{\pm 3k}\) the subject. They need to multiply by the \(1+7e^{-3k}\) term, and proceed to \(e^{\pm 3k}=A,\quad A>0\)
A1 The correct intermediate answer of \(e^{-3k}=\dfrac{2.2}{7},\dfrac{11}{35}\) or equivalent. Accept awrt 0.31..
Alternatively accept \(e^{3k}=\dfrac{35}{11},\ 3.18..\) or equivalent.
M1 Proceeds from \(e^{\pm 3k}=A,\quad A>0\) by correctly taking ln’s and then making \(k\) the subject of the formula.
Award for \(e^{-3k}=A\Rightarrow -3k=\ln(A)\Rightarrow k=\dfrac{\ln(A)}{-3}\)
If \(e^{3k}\) was found accept \(e^{3k}=C\Rightarrow 3k=\ln C\Rightarrow k=\dfrac{\ln C}{3}\) As with method 1, \(C>0\)
A1 Awrt \(k=0.386\) 3dp
| Scheme | Marks |
|---|---|
| Sub t=10 into \(P=\dfrac{8000}{1+7e^{-0.386t}}\Rightarrow P=6970\) cao | M1A1 |
| (2) |
Notes
M1 Substitutes t=10 into \(P=\dfrac{8000}{1+7e^{-kt}}\) with their numerical value of \(k\) to find \(P\)
A1 \((P=)6970\) or other exact equivalents like \(6.97\times 10^3\)
| Scheme | Marks |
|---|---|
| \(\dfrac{\mathrm{d}P}{\mathrm{d}t}=-\dfrac{8000}{(1+7e^{-kt})^2}\times-7ke^{-kt}\) | M1,A1 |
| Sub t=10 \(\quad\left.\dfrac{\mathrm{d}P}{\mathrm{d}t}\right|_{t=10}=346\) | A1 |
| (3) | |
| (13 marks) |
Notes
M1 Differentiates using the chain rule to a form \(\dfrac{\mathrm{d}P}{\mathrm{d}t}=\dfrac{C}{(1+7e^{-kt})^2}\times e^{-kt}\)
Accept an application of the quotient rule to achieve \(\dfrac{(1+7e^{-kt})\times 0-C\times-e^{-kt}}{(1+7e^{-kt})^2}\)
A1 A correct un simplified \(\dfrac{\mathrm{d}P}{\mathrm{d}t}=-\dfrac{8000}{(1+7e^{-kt})^2}\times-7ke^{-kt}\).
The derivative can be given in terms of \(k\). If a numerical value is used you may follow through on incorrect values.
A1 Awrt 346. Note that M1 must have been achieved. Just the answer scores 0