
C3 June 2012 Q4
4.
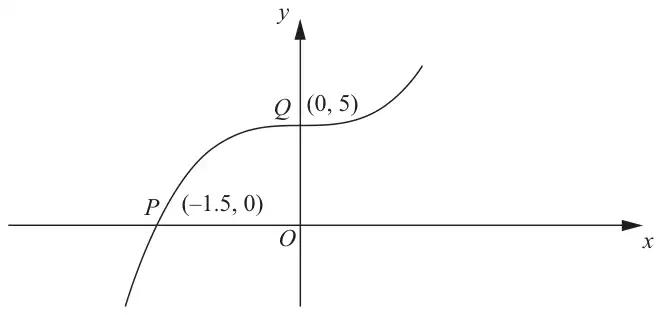
Figure 2 shows part of the curve with equation \(y = \mathrm{f}(x)\)
The curve passes through the points \(P(-1.5, 0)\) and \(Q(0, 5)\) as shown.
On separate diagrams, sketch the curve with equation
Indicate clearly on each sketch the coordinates of the points at which the curve crosses or meets the axes.
| Scheme | Marks |
|---|---|
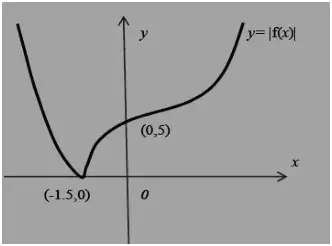
| Shape including cusp | B1 |
| (-1.5, 0) and (0, 5) | B1 |
| (2) |
Notes
Note that this appears as M1A1 on EPEN
B1 Shape (inc cusp) with graph in just quadrants 1 and 2. Do not be overly concerned about relative gradients, but the left hand section of the curve should not bend back beyond the cusp
B1 This is independent, and for the curve touching the x-axis at (-1.5, 0) and crossing the y-axis at (0,5)
| Scheme | Marks |
|---|---|
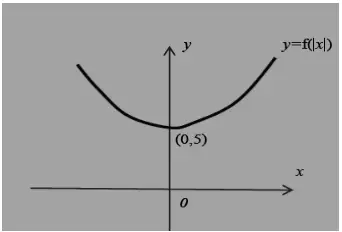
| Shape | B1 |
| (0,5) | B1 |
| (2) |
Notes
Note that this appears as M1A1 on EPEN
B1 For a U shaped curve symmetrical about the y- axis
B1 (0,5) lies on the curve
| Scheme | Marks |
|---|---|
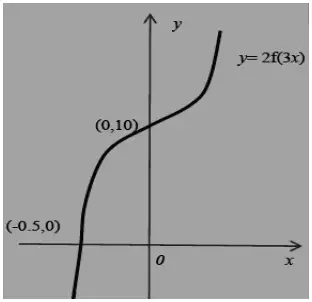
| Shape | B1 |
| (0,10) | B1 |
| (-0.5, 0) | B1 |
| (3) | |
| (7 marks) |
Notes
Note that this appears as M1B1B1 on EPEN
B1 Correct shape- do not be overly concerned about relative gradients. Look for a similar shape to f(x)
B1 Curve crosses the y axis at (0, 10). The curve must appear in both quadrants 1 and 2
B1 Curve crosses the x axis at (-0.5, 0). The curve must appear in quadrants 3 and 2.
In all parts accept the following for any co-ordinate. Using (0,3) as an example, accept both (3,0) or 3 written on the y axis (as long as the curve passes through the point)
Special case with (a) and (b) completely correct but the wrong way around mark - SC(a) 0,1 SC(b) 0,1
Otherwise follow scheme