
C3 June 2009 Q5
5.
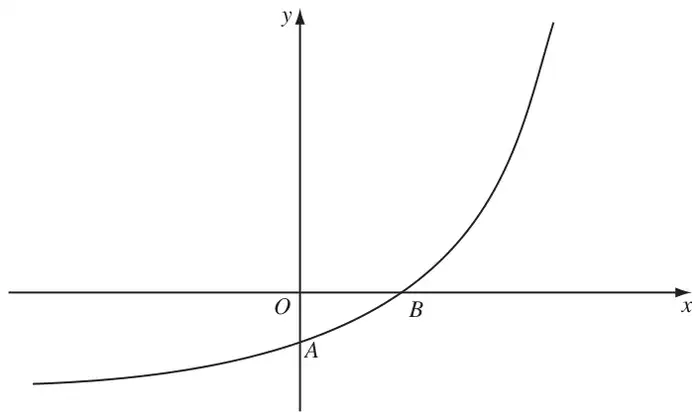
Figure 2 shows a sketch of part of the curve with equation \(y = \mathrm{f}(x)\), \(x \in \mathbb{R}\).
The curve meets the coordinate axes at the points \(A(0, 1 - k)\) and \(B\left(\tfrac{1}{2}\ln k, 0\right)\), where \(k\) is a constant and \(k \gt 1\), as shown in Figure 2.
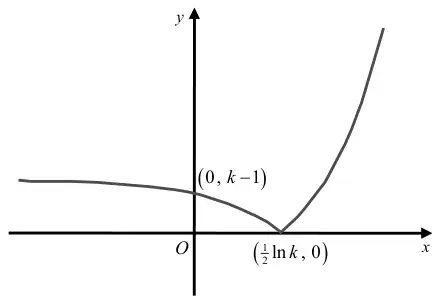
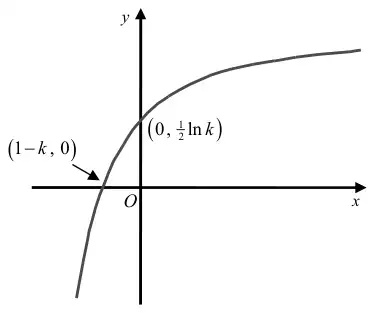
On separate diagrams, sketch the curve with equation
Show on each sketch the coordinates, in terms of \(k\), of each point at which the curve meets or cuts the axes.
Given that \(\mathrm{f}(x) = \mathrm{e}^{2x} - k\),
| Scheme | Marks |
|---|---|
 | B1 B1 B1 |
| (3) |
Notes
B1: Curve retains shape when \(x \gt \tfrac{1}{2}\ln k\)
B1: Curve reflects through the \(x\)-axis when \(x \lt \tfrac{1}{2}\ln k\)
B1: \((0, k - 1)\) and \(\left(\tfrac{1}{2}\ln k, 0\right)\) marked in the correct positions.
| Scheme | Marks |
|---|---|
 | B1 B1 |
| (2) |
Notes
B1: Correct shape of curve. The curve should be contained in quadrants 1, 2 and 3 (Ignore asymptote)
B1: \((1 - k, 0)\) and \(\left(0, \tfrac{1}{2}\ln k\right)\)
| Scheme | Marks |
|---|---|
| Range of f: \(\underline{\mathrm{f}(x) \gt -k}\) or \(\underline{y \gt -k}\) or \(\underline{(-k, \infty)}\) | B1 |
| (1) |
Notes
B1: Either \(\underline{\mathrm{f}(x) \gt -k}\) or \(\underline{y \gt -k}\) or \(\underline{(-k, \infty)}\) or \(\underline{\mathrm{f} \gt -k}\) or \(\underline{\text{Range} \gt -k}\).
| Scheme | Marks |
|---|---|
| \(y = \mathrm{e}^{2x} - k \Rightarrow y + k = \mathrm{e}^{2x}\) \(\Rightarrow \ln(y + k) = 2x\) \(\Rightarrow \tfrac{1}{2}\ln(y + k) = x\) | M1 M1 |
| Hence \(\mathrm{f}^{-1}(x) = \underline{\tfrac{1}{2}\ln(x + k)}\) | A1 cao |
| (3) |
Notes
M1: Attempt to make \(x\) (or swapped \(y\)) the subject
M1: Makes \(\mathrm{e}^{2x}\) the subject and takes ln of both sides
A1 cao: \(\underline{\tfrac{1}{2}\ln(x + k)}\) or \(\underline{\ln\sqrt{(x + k)}}\)
| Scheme | Marks |
|---|---|
| \(\mathrm{f}^{-1}(x)\): Domain: \(\underline{x \gt -k}\) or \(\underline{(-k, \infty)}\) | B1ft |
| (1) | |
| (10 marks) |
Notes
B1ft: Either \(\underline{x \gt -k}\) or \(\underline{(-k, \infty)}\) or Domain \(\gt -k\) or \(x\) “ft one sided inequality” their part (c) RANGE answer