
C3 June 2006 Q3
3.
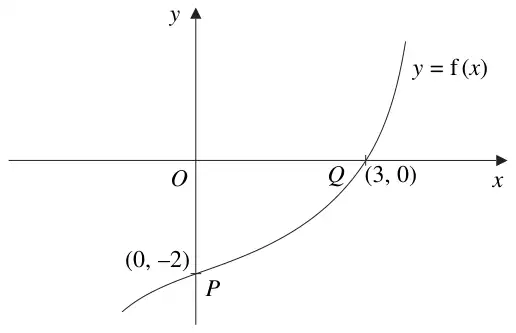
Figure 1 shows part of the curve with equation \(y = \mathrm{f}(x)\), \(x \in \mathbb{R}\), where f is an increasing function of \(x\). The curve passes through the points \(P(0, -2)\) and \(Q(3, 0)\) as shown.
In separate diagrams, sketch the curve with equation
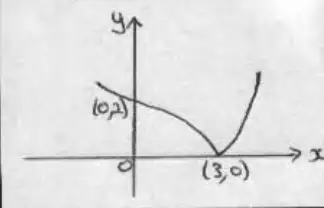
(a) \(y = |\mathrm{f}(x)|\), (3)
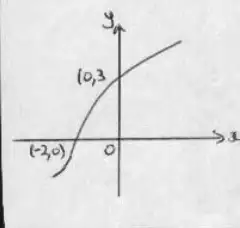
(b) \(y = \mathrm{f}^{-1}(x)\), (3)
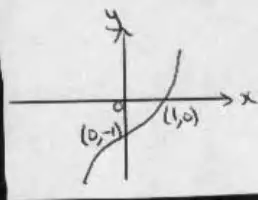
(c) \(y = \tfrac{1}{2}\mathrm{f}(3x)\). (3)
Indicate clearly on each sketch the coordinates of the points at which the curve crosses or meets the axes.
| Scheme | Marks |
|---|---|
| Mod graph, reflect for \(y \lt 0\) | M1 |
| \((0, 2)\), \((3, 0)\) or marked on axes | A1 |
| Correct shape, including cusp | A1 |
| (3) |
| Scheme | Marks |
|---|---|
| Attempt at reflection in \(y = x\) | M1 |
| Curvature correct | A1 |
| \((-2, 0)\), \((0, 3)\) or equiv. | B1 |
| (3) |
| Scheme | Marks |
|---|---|
| Attempt at ‘stretches’ | M1 |
| \((0, -1)\) or equiv. | B1 |
| \((1, 0)\) | B1 |
| (3) | |
| (9 marks) |