
C3 January 2012 Q2
2.
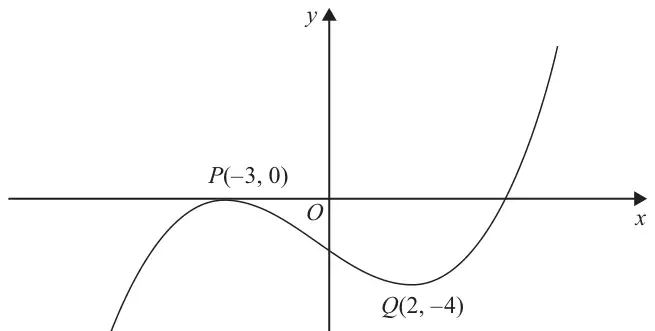
Figure 1 shows the graph of equation \(y = \mathrm{f}(x)\).
The points \(P(-3, 0)\) and \(Q(2, -4)\) are stationary points on the graph.
Sketch, on separate diagrams, the graphs of
On each diagram, show the coordinates of any stationary points.
| Scheme | Marks |
|---|---|
| Shape | B1 |
| \(x\) coordinates correct | B1 |
| y coordinates correct | B1 |
| (3) |
Notes
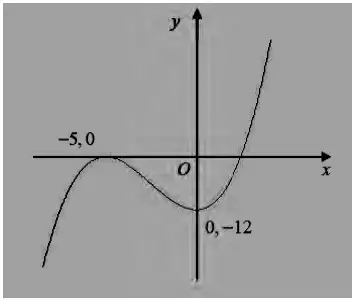
B1 Shape unchanged. The positioning of the curve is not significant for this mark. The right hand section of the curve does not have to cross \(x\) axis.
B1 The x- coordinates of P’ and Q’ are -5 and 0 respectively. This is for translating the curve 2 units left. The minimum point Q’ must be on the y axis. Accept if -5 is marked on the x axis for P’ with Q’ on the \(y\) axis (marked -12).
B1 The y- coordinates of P’ and Q’ are 0 and -12 respectively. This is for the stretch \(\times 3\) parallel to the \(y\) axis. The maximum P’ must be on the \(x\) axis. Accept if -12 is marked on the y axis for Q’ with P’ on the x axis (marked -5)
| Scheme | Marks |
|---|---|
| Shape | B1 |
| Max at (2,4) | B1 |
| Min at (-3,0) | B1 |
| (3) | |
| (6 marks) |
Notes
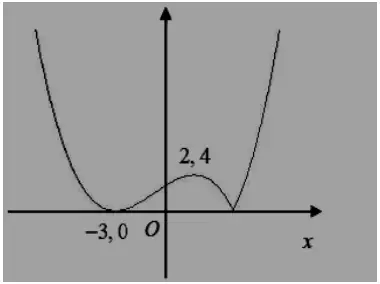
B1 The curve below the x axis reflected in the x axis and the curve above the x axis is unchanged. Do not accept if the curve is clearly rounded off with a zero gradient at the x axis but allow small curvature issues. Use the same principles on the lhs- do not accept if this is a cusp.
B1 Both the x- and y- coordinates of Q’, (2,4) given correctly and associated with the maximum point in the first quadrant. To gain this mark there must be a graph and it must only have one maximum.
Accept as 2 and 4 marked on the correct axes or in the script as long as there is no ambiguity.
B1 Both the x- and y- coordinates of P’, (-3,0) given correctly and associated with the minimum point in the second quadrant. To gain this mark there must be a graph. Tolerate two cusps if this mark has been lost earlier in the question. Accept (0, -3) marked on the correct axis.