
C1 June 2014 Q4
4.
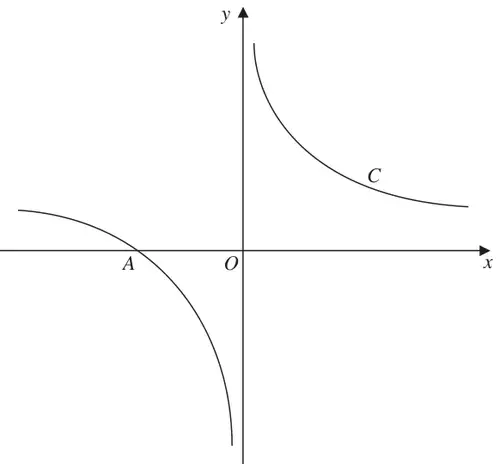
Figure 1 shows a sketch of the curve \(C\) with equation\[y = \frac{1}{x} + 1, \qquad x \neq 0\]The curve \(C\) crosses the \(x\)-axis at the point \(A\).
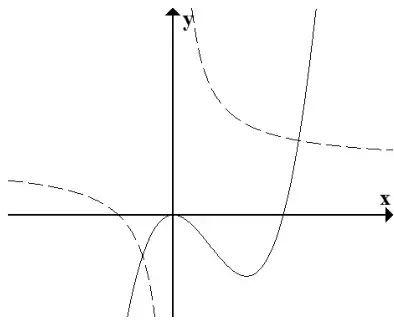
The curve \(D\) has equation \(y = x^2(x - 2)\), for all real values of \(x\).
On this copy, sketch a graph of curve \(D\).
Show on the sketch the coordinates of each point where the curve \(D\) crosses the coordinate axes. (3)
| Scheme | Marks |
|---|---|
| \(-1\) accept \((-1, 0)\) | B1 |
| (1) |
Notes
N.B. Check original diagram as answer may appear there.
B1: The \(x\) coordinate of \(A\) is \(-1\). Accept \(-1\) or \((-1, 0)\) on the diagram or stated with or without diagram
Allow \((0, -1)\) on the diagram if it is on the correct axis.
| Scheme | Marks |
|---|---|
| Shape | B1 |
| Touches at \((0,0)\) | B1 |
| Crosses at \((2,0)\) only | B1 |
| (3) |
Notes
If no graph is drawn then no marks are available in part (b)
B1: Correct shape. The position is not important for this mark but the curve must have two clear turning points and be a +ve \(x^3\) curve (with a maximum and minimum)
B1: The graph touches the origin. Accept touching as a maximum or minimum. There must be a sketch for this mark but sketch may be wrong and this mark is independent of previous mark. Origin is where axes cross and may not be labelled. This may be a quadratic or quartic curve for this mark.
B1: The graph crosses the \(x\)-axis at the point \((2,0)\) only. If it crosses at \((2,0)\) and \((0,0)\) this is B0. Accept \((0,2)\) or 2 marked on the correct axis. Accept \((2, 0)\) in the text of the answer provided that the curve crosses the positive \(x\) axis. There must be a sketch for this mark. Do not give credit if \((2,0)\) appears only in a table with no indication that this is the intersection point. (If in doubt send to review) Graph takes precedence over text for third B mark.
| Scheme | Marks |
|---|---|
| 2 solutions as curves cross twice | B1 ft |
| (1) | |
| (5 marks) |
Notes
B1ft: Two (solutions) as there are two intersections (of the curves) N.B. Just states 2 with no reason is B0
If the answer states 2 roots and two intersections – or crosses twice this is enough for B1
BUT B0 If there is any wrong reason given – e.g. crosses \(x\) axis twice, or crosses asymptote twice
Isw – is not used for this mark so any wrong statement listed to follow a correct statement will result in B0
Allow ft – so if their graph crosses the hyperbola once – allow “one solution as there is one intersection”
And if it crosses three times – allow “three solutions as there are three intersections” or four etc..
If it does not cross at all (e.g.negative cubic) – allow “no solutions as there are no intersections”
However in (c) if they have sketched a curve (even a fully correct one) but not extended it to intersect the hyperbola and they put "no points of intersection so no solutions" then this scores B0.
Accept “lines or curves cross over twice, or touch twice, or meet twice…etc as explanation, but need some form of words)