
C1 June 2013 (R) Q9
9.
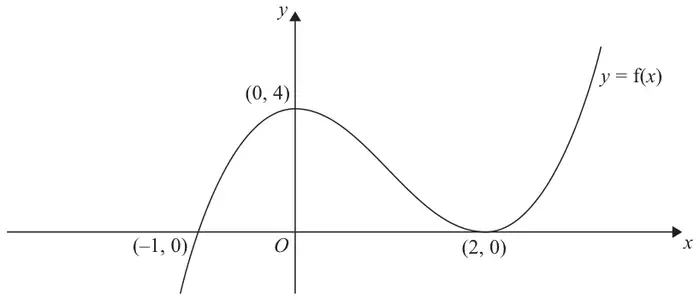
Figure 1 shows a sketch of the curve \(C\) with equation \(y = \mathrm{f}(x)\).
The curve \(C\) passes through the point \((-1, 0)\) and touches the \(x\)-axis at the point \((2, 0)\).
The curve \(C\) has a maximum at the point \((0, 4)\).
Calculate the values of \(a\), \(b\) and \(c\). (5)
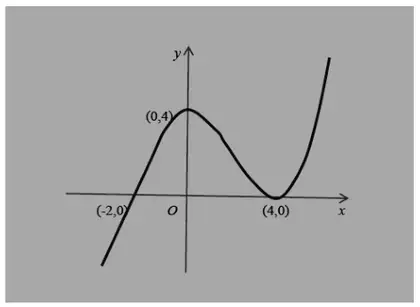
Show clearly the coordinates of all the points where the curve crosses or meets the coordinate axes. (3)
Way 1
| Scheme | Marks |
|---|---|
| \(f(x) = (x + 1)(x - 2)^2\) | M1A1B1 |
| \(= (x + 1)(x^2 - 4x + 4) = x^3 - 3x^2 + 4\) | M1A1 |
| (5) |
Notes
M1: Either stating or writing down that \((x \pm 1)\) or \((x \pm 2)\) is a factor – may be implied by their f(\(x\))
A1: Both \((x + 1)\) and \((x - 2)\) are factors - may be implied by their f(\(x\))
B1: \(y\) or f(\(x\))= \((x + 1)(x - 2)^2\)
M1: Multiplying out a quadratic to get 3 terms and then multiplying by the linear term to form a cubic.
A1: \(x^3 - 3x^2 + 4\) or \(a = -3\), \(b = 0\), \(c = 4\)
(a) Way 2
| Scheme | Marks |
|---|---|
| \(x = 0, y = 4 \Rightarrow c = 4\) | B1 |
| \(x = -1, y = 0 \Rightarrow -1 + a - b + c = 0\) \(x = 2, y = 0 \Rightarrow 8 + 4a + 2b + c = 0\) | M1 |
| \(a - b = -3\) \(4a + 2b = -12\) \(\Rightarrow a = ..\ \textit{or}\ b = \ldots\) | M1 |
| Either \(a = -3\) or \(b = 0\) | A1 |
| Both \(a = -3\) and \(b = 0\) | A1 |
B1: Uses \((0, 4)\) to obtain \(c = 4\) (can be just stated)
M1: Uses both \((-1, 0)\) and \((2, 0)\) in \(y = x^3 + ax^2 + bx + c\) to form 2 simultaneous equations. Allow the equations to contain \(c\) here.
M1: Solves simultaneously with a value for \(c\) to obtain a value for \(a\) or a value for \(b\)
(a) Way 3
| Scheme | Marks |
|---|---|
| \(\dfrac{\mathrm{d}y}{\mathrm{d}x} = 3x^2 + 2ax + b\) | M1 |
| \(x = 0 \Rightarrow \dfrac{\mathrm{d}y}{\mathrm{d}x} = 0 \Rightarrow b = 0\) | A1 |
| \(x = 0, y = 4 \Rightarrow c = 4\) | B1 |
| \(3(2)^2 + 2a(2) + b = 0\) or \((-1)^3 + a(-1)^2 + b(-1) + 4 = 0\) | M1 |
| \(a = -3\) | A1 |
| (5) |
M1: \(x^n \to x^{n-1}\) at least once including c → 0
A1: Correct value for \(b\)
B1: Uses \((0, 4)\) to obtain \(c = 4\) (can be just stated)
M1: Obtains an equation in \(a\)
A1: Correct value for \(a\)
Special case:
A common incorrect approach is to assume the cubic is of the form e.g. \(f(x) = x(x \pm 1)(x \pm 2) + 4\)
This scores B1 only for \(c = 4\)
| Scheme | Marks |
|---|---|
| Same shape and position (ignore any coordinates) with the maximum on the y-axis | B1 |
| \(y\) intercept = 4 or their ‘\(c\)’ | B1ft |
| \(x\) coordinates at −2 and 4 or marked as coordinates. Allow \((0, -2)\) and \((0, 4)\) if they are marked in the correct position. The curve must cross or at least stop at \(x = -2\) | B1 |
| (3) | |
| (8 marks) |