
C1 January 2010 Q8
8.
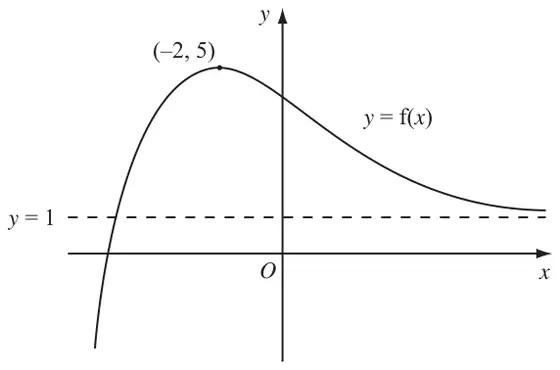
Figure 1 shows a sketch of part of the curve with equation \(y = \mathrm{f}(x)\).
The curve has a maximum point \((-2, 5)\) and an asymptote \(y = 1\), as shown in Figure 1.
On separate diagrams, sketch the curve with equation
On each diagram, show clearly the coordinates of the maximum point and the equation of the asymptote.
| Scheme | Marks |
|---|---|
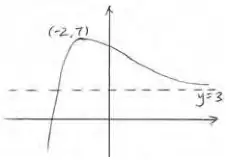
| \((-2, 7), \qquad y = 3\) (Marks are dependent upon a sketch being attempted) See conditions below. | B1, B1 |
| (2) |
Notes
Parts (a) and (b):
(i) If only one of the B marks is scored, there is no penalty for a wrong sketch.
(ii) If both the maximum and the equation of the asymptote are correct, the sketch must be “correct” to score B1 B1. If the sketch is “wrong”, award B1 B0.
The (generous) conditions for a “correct” sketch are that the maximum must be in the 2nd quadrant and that the curve must not cross the positive \(x\)-axis... ignore other “errors” such as “curve appearing to cross its asymptote” and “curve appearing to have a minimum in the 1st quadrant”.
Coordinates of maximum:
If the coordinates are the wrong way round (e.g. \((7, -2)\) in part (a)), or the coordinates are just shown as values on the \(x\) and \(y\) axes, penalise only once in the whole question, at first occurrence.
Asymptote marks:
If the equation of the asymptote is not given,
e.g. in part (a), 3 is marked on the \(y\)-axis but \(y = 3\) is not seen, penalise only once in the whole question, at first occurrence.
Ignore extra asymptotes stated (such as \(x = 0\)).
| Scheme | Marks |
|---|---|
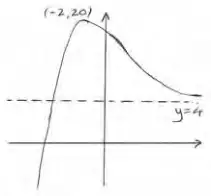
| \((-2, 20), \quad y = 4\) (Marks are dependent upon a sketch being attempted) See conditions below. | B1, B1 |
| (2) |
Notes
Parts (a) and (b):
(i) If only one of the B marks is scored, there is no penalty for a wrong sketch.
(ii) If both the maximum and the equation of the asymptote are correct, the sketch must be “correct” to score B1 B1. If the sketch is “wrong”, award B1 B0.
The (generous) conditions for a “correct” sketch are that the maximum must be in the 2nd quadrant and that the curve must not cross the positive \(x\)-axis... ignore other “errors” such as “curve appearing to cross its asymptote” and “curve appearing to have a minimum in the 1st quadrant”.
Special case:
(b) Stretch \(\dfrac{1}{4}\) instead of 4: Correct shape, with \(\left(-2, \dfrac{5}{4}\right),\ y = \dfrac{1}{4}\) : B1 B0.
Coordinates of maximum:
If the coordinates are the wrong way round (e.g. \((7, -2)\) in part (a)), or the coordinates are just shown as values on the \(x\) and \(y\) axes, penalise only once in the whole question, at first occurrence.
Asymptote marks:
If the equation of the asymptote is not given,
e.g. in part (a), 3 is marked on the \(y\)-axis but \(y = 3\) is not seen, penalise only once in the whole question, at first occurrence.
Ignore extra asymptotes stated (such as \(x = 0\)).
| Scheme | Marks |
|---|---|
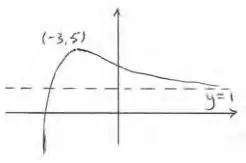
| Sketch: Horizontal translation (either way)… (There must be evidence that \(y = 5\) at the max and that the asymptote is still \(y = 1\)) | B1 |
| \((-3, 5), \qquad y = 1\) | B1, B1 |
| (3) | |
| (7 marks) |
Notes
Coordinates of maximum:
If the coordinates are the wrong way round (e.g. \((7, -2)\) in part (a)), or the coordinates are just shown as values on the \(x\) and \(y\) axes, penalise only once in the whole question, at first occurrence.
Asymptote marks:
If the equation of the asymptote is not given,
e.g. in part (a), 3 is marked on the \(y\)-axis but \(y = 3\) is not seen, penalise only once in the whole question, at first occurrence.
Ignore extra asymptotes stated (such as \(x = 0\)).