
C1 January 2006 Q6
6.
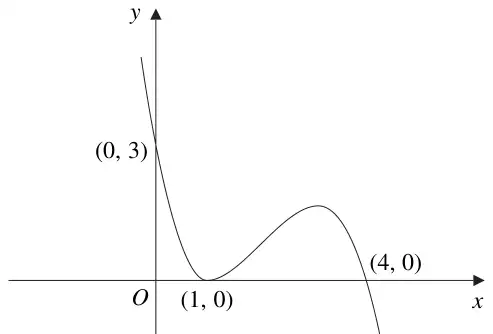
Figure 1 shows a sketch of the curve with equation \(y = \mathrm{f}(x)\). The curve passes through the points \((0, 3)\) and \((4, 0)\) and touches the \(x\)-axis at the point \((1, 0)\).
On separate diagrams sketch the curve with equation
(a) \(y = \mathrm{f}(x + 1)\), (3)
(b) \(y = 2\mathrm{f}(x)\), (3)
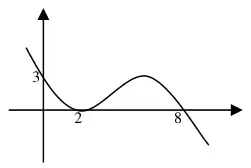
(c) \(y = \mathrm{f}\left(\dfrac{1}{2}x\right)\). (3)
On each diagram show clearly the coordinates of all the points where the curve meets the axes.
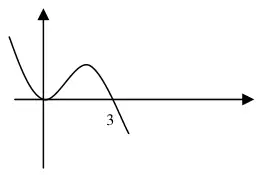
| Scheme | Marks |
|---|---|
| (See below) | M1 |
| Clearly through origin (or \((0, 0)\) seen) | A1 |
| 3 labelled (or \((3, 0)\) seen) | A1 |
| (3) |
Notes
(a) M1: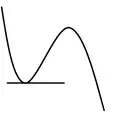
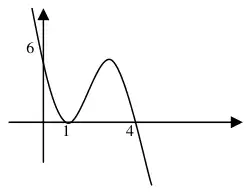
| Scheme | Marks |
|---|---|
| Stretch parallel to \(y\)-axis | M1 |
| 1 and 4 labelled (or \((1, 0)\) and \((4, 0)\) seen) | A1 |
| 6 labelled (or \((0, 6)\) seen) | A1 |
| (3) |
Notes
(b) M1: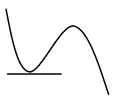
\((4, 0)\) unchanged
\((0, 3)\) changed
| Scheme | Marks |
|---|---|
| Stretch parallel to \(x\)-axis | M1 |
| 2 and 8 labelled (or \((2, 0)\) and \((8, 0)\) seen) | A1 |
| 3 labelled (or \((0, 3)\) seen) | A1 |
| (3) | |
| (9 marks) |
Notes
(c) M1: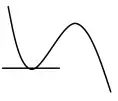
\((4, 0)\) changed
\((0, 3)\) unchanged