
Higher November 2020 Paper 1R Q11
11 The frequency table gives information about the ages of the 80 people in a train carriage.
| Age (\(a\) years) | Frequency |
|---|---|
| \(0 \lt a \leqslant 20\) | 9 |
| \(20 \lt a \leqslant 30\) | 19 |
| \(30 \lt a \leqslant 40\) | 17 |
| \(40 \lt a \leqslant 50\) | 18 |
| \(50 \lt a \leqslant 60\) | 13 |
| \(60 \lt a \leqslant 70\) | 4 |
(a) Complete the cumulative frequency table. (1)
| Age (\(a\) years) | Cumulative frequency |
|---|---|
| \(0 \lt a \leqslant 20\) | |
| \(0 \lt a \leqslant 30\) | |
| \(0 \lt a \leqslant 40\) | |
| \(0 \lt a \leqslant 50\) | |
| \(0 \lt a \leqslant 60\) | |
| \(0 \lt a \leqslant 70\) |
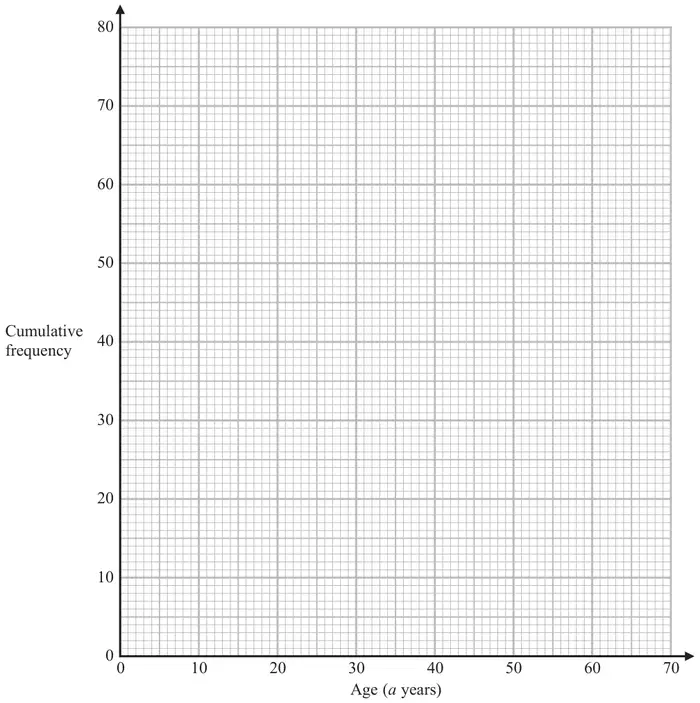
(b) On the grid, draw a cumulative frequency graph for your table. (2)
(c) Use your graph to find an estimate for the median age of the people in the train carriage. (2)
| Scheme | Marks |
|---|---|
| 9, 28, 45, 63, 76, 80 | B1 |
| (1) |
| Scheme | Marks |
|---|---|
| B2 | |
| (2) |
Notes
B2: for a correct cf graph with points at ends of intervals and joined with a curve or line segments
If not B2 then B1 for 5 or 6 of their points (ft from a table with only one arithmetic error) at ends of intervals and joined with a curve or line segments
OR for 5 or 6 points plotted correctly at ends of intervals not joined
OR for 5 or 6 of their points from table plotted consistently within each interval (not at upper ends of intervals) at their correct heights and joined with a curve or line segments
| Scheme | Marks |
|---|---|
| e.g. reading across from 40 and reading down | M1 |
| 35 - 38 | A1 |
| (2) | |
| (5 marks) |
Notes
M1: ft reading from a cf graph provided method is shown
A1: ft from their cf graph