
Higher November 2020 Paper 2 Q10
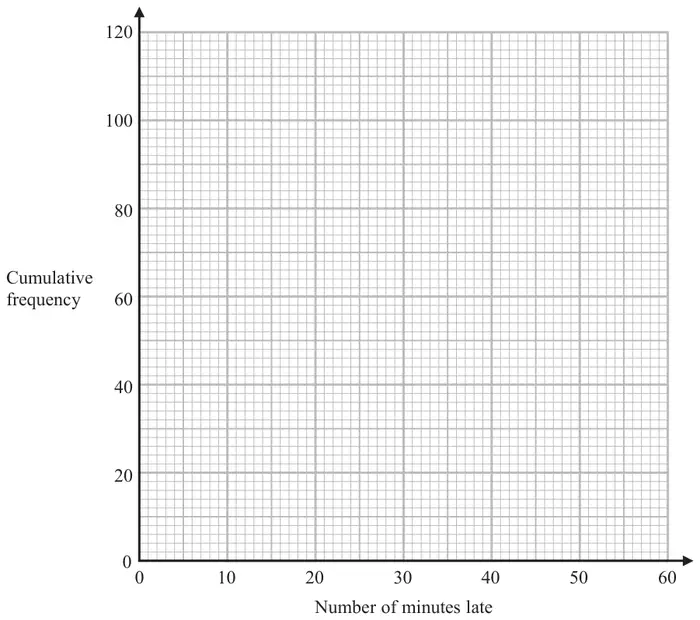
10 The table shows information about the number of minutes each of 120 buses was late last Monday.
| Number of minutes late (\(L\)) | Frequency |
|---|---|
| \(0 \lt L \leqslant 10\) | 10 |
| \(10 \lt L \leqslant 20\) | 16 |
| \(20 \lt L \leqslant 30\) | 44 |
| \(30 \lt L \leqslant 40\) | 29 |
| \(40 \lt L \leqslant 50\) | 15 |
| \(50 \lt L \leqslant 60\) | 6 |
| Number of minutes late (\(L\)) | Cumulative frequency |
|---|---|
| \(0 \lt L \leqslant 10\) | |
| \(0 \lt L \leqslant 20\) | |
| \(0 \lt L \leqslant 30\) | |
| \(0 \lt L \leqslant 40\) | |
| \(0 \lt L \leqslant 50\) | |
| \(0 \lt L \leqslant 60\) |
| Scheme | Marks |
|---|---|
| 10, 26, 70, 99, 114, 120 | B1 |
| (1) |
| Scheme | Marks |
|---|---|
| correct cumulative frequency graph | B2 |
| (2) |
Notes
B2: fully correct cf graph – points at ends of intervals and joined with curve or line segments
If not B2 then B1
for 5 or 6 (ft from a table with only one arithmetic error) of their points at ends of intervals and joined with curve or line segments
OR for 5 or 6 points plotted correctly at ends of intervals not joined
OR for 5 or 6 of their points from table plotted consistently within each interval (not at upper ends of intervals) at their correct heights and joined with smooth curve or line segments
| Scheme | Marks |
|---|---|
| M1 | |
| Correct answer scores full marks (unless from obvious incorrect working) Answer: 16 | A1 |
| (2) |
Notes
M1: For use of 30 and 90, or 30.25 and 90.75 (eg reading of 21 and 37 stated or indicated by marks on horizontal axis that correspond to 30 (or 30.25) and 90 (or 90.75) on the vertical axis or correct readings ft their cf graph provided method to show readings is shown)
A1: accept 14 – 18, ft from their cf graph (ft provided method to show readings is shown)
| Scheme | Marks |
|---|---|
| M1 | |
| Correct answer scores full marks (unless from obvious incorrect working) Answer: 9 | A1 |
| (2) | |
| (7 marks) |
Notes
M1: For use of cf from number of minutes late being 48 (eg an indication by a mark on the vertical axis corresponding to 48 mins late or a correct reading ft their cf graph)
A1: accept 7 – 10, ft from their cf graph