
Higher January 2020 Paper 1R Q18
18 The diagram shows the graph of \(\;y = \mathrm{f}(x)\;\) for \(\;-4 \leqslant x \leqslant 12\)
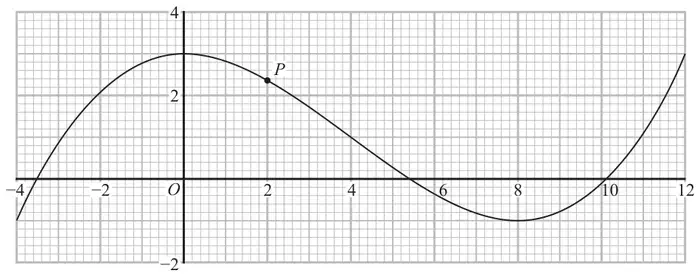
The point \(P\) on the curve has \(x\) coordinate 2
Give your answer in the form \(\;y = mx + c\) (2)
The equation \(\;\mathrm{f}(x) = k\;\) has exactly two different solutions for \(\;-4 \leqslant x \leqslant 12\)
| Scheme | Marks |
|---|---|
| B1 | |
| M1 | |
| Working required Answer: −0.6 | A1 |
| (3) |
Notes
B1: tangent drawn at \(P\) (\(x = 2\))
M1: (dep on B1) for a method to find gradient e.g. \(\dfrac{\text{difference in } y\text{-values}}{\text{difference in } x\text{-values}}\)
A1: (dep on B1) accept answers in range −0.4 to −0.7 and from correct figures for their line
| Scheme | Marks |
|---|---|
| e.g. \(y = -0.6x + c\) or \(y = mx + 3.6\) or \(2.4 = -0.6 \times 2 + c\) | M1 |
| \(y = -0.6x + 3.6\) | A1 |
| (2) |
Notes
M1: for start of method to find the tangent equation e.g. \(y = mx + c\) where \(m\) is their gradient or \(y = mx + c\) where \(c\) is the \(y\)-intercept for their tangent or for substituting a point from the curve e.g. (2, 2.4) into \(y = mx + c\) where \(m\) is their gradient
A1: ft their gradient from (i) and intercept of their tangent, so long as intercept / value of \(c\) is \(\gt 3\)
| Scheme | Marks |
|---|---|
| 3 | B1 |
| −1 | B1 |
| (2) | |
| (7 marks) |