
Higher January 2020 Paper 1R Q12
12 The cumulative frequency graph gives information about the waiting times, in minutes, of people with appointments at Hospital A.
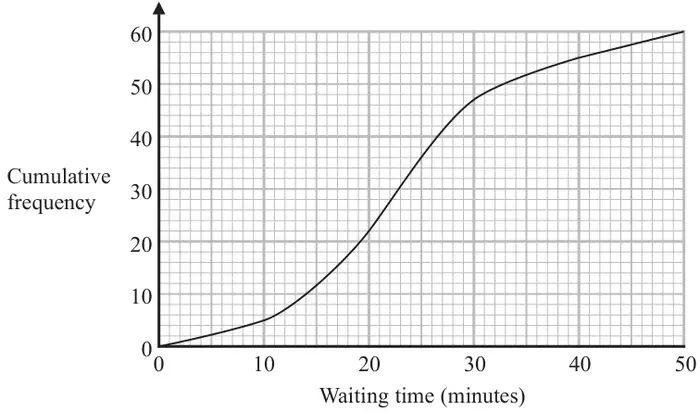
(a) Use the graph to find an estimate of the median waiting time at Hospital A. (1)
(b) Use the graph to find an estimate of the interquartile range of the waiting times at Hospital A. (2)
At a different hospital, Hospital B, the median waiting time is 28 minutes and the interquartile range of the waiting times is 19 minutes.
(c) Compare the waiting times at Hospital A with the waiting times at Hospital B. (2)
| Scheme | Marks |
|---|---|
| 23 | B1 |
| (1) |
Notes
B1: accept 22 – 24
| Scheme | Marks |
|---|---|
| e.g. 29 − 17 | M1 |
| 12 | A1 |
| (2) |
Notes
M1: For subtracting readings from 15 and 45
A1: accept 10 – 14
| Scheme | Marks |
|---|---|
| B1 | |
| Two comparisons (at least one of which must be in context) | B1 |
| (2) | |
| (5 marks) |
Notes
B1: ft comparison of the medians
B1: ft comparison of the IQR
Note: to award 2 marks at least one comparison must be in context