
Foundation January 2020 Paper 2 Q4
4 The pictogram gives information about the number of rickshaws sold from a garage each month from January to April.
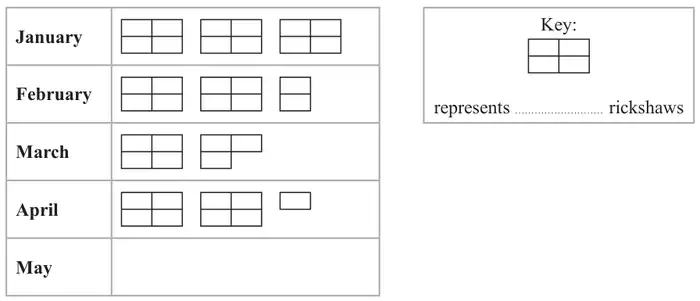
36 rickshaws were sold in January.
(a) Complete the key. (1)
(b) How many rickshaws were sold in February? (1)
15 rickshaws were sold in May from the garage.
(c) Show this information on the pictogram. (1)
Sandeep makes a profit of 5000 rupees on each rickshaw sold from the garage.
His target profit for January was 200 000 rupees.
(d) Did Sandeep reach his target profit for January?
You must show your working. (2)
You must show your working. (2)
| Scheme | Marks |
|---|---|
| 12 | B1 |
| (1) |
| Scheme | Marks |
|---|---|
| ‘12’ × 2.5 Answer: 30 | B1ft |
| (1) |
Notes
B1ft: Ft their 12
| Scheme | Marks |
|---|---|
| One and a quarter rectangles Answer: One and a quarter rectangles drawn oe | B1 |
| (1) |
Notes
B1: ft their 12
| Scheme | Marks |
|---|---|
| 36 × 5000 (= 180 000) or 200 000 ÷ 5000 (= 40) | M1 |
| No and 180 000 | A1 |
| (2) | |
| (5 marks) |
Notes
A1: for no oe and 180 000 or
no oe and 40 or
no oe and 20 000 short or
20 000 and short/off