
Foundation January 2020 Paper 1 Q2
2 The bar chart shows information about the weight, in millions of tonnes, of bananas produced by each of four countries in 2016
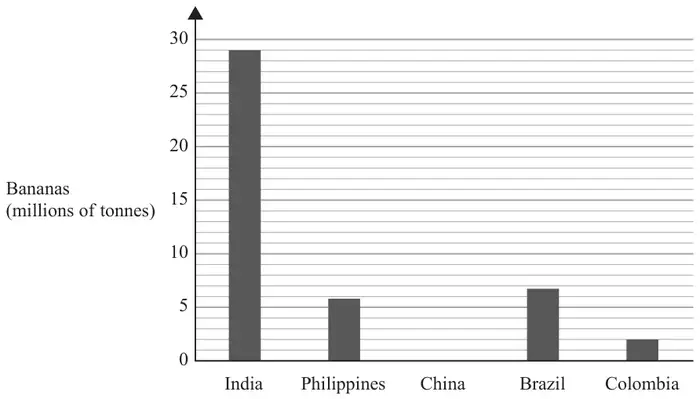
In 2016, China produced 13 million tonnes of bananas.
(a) Draw a bar on the bar chart to show this information. (1)
One of these countries produced 6.8 million tonnes of bananas in 2016
(b) Which country? (1)
In 2016, a total of 113 million tonnes of bananas was produced worldwide.
(c) What fraction of the 113 million tonnes of bananas was produced in India in 2016? (2)
| Scheme | Marks |
|---|---|
| correct bar | B1 |
| (1) |
Notes
B1: for bar drawn at correct height of 13
Allow a line instead of a bar
| Scheme | Marks |
|---|---|
| Brazil | B1 |
| (1) |
| Scheme | Marks |
|---|---|
| 29 | M1 |
| \(\dfrac{29}{113}\) | A1 |
| (2) | |
| (4 marks) |
Notes
M1: for \(\dfrac{29}{k}\) with \(k \gt 29\) or \(\dfrac{n}{113}\) with \(n \lt 113\) oe
May work in millions
Allow incorrect notation e.g. 29 out of 113 or 29:113 oe
A1: oe Allow 0.26 or 0.256(6371…)