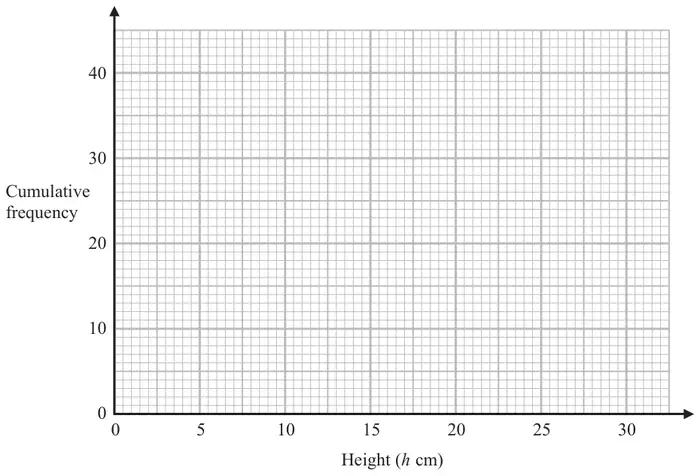
12 The cumulative frequency table gives information about the heights, in cm, of 40 plants.
Height (\(h\) cm)
Cumulative Frequency
\(0 \lt h \leqslant 5\)
4
\(0 \lt h \leqslant 10\)
11
\(0 \lt h \leqslant 15\)
24
\(0 \lt h \leqslant 20\)
34
\(0 \lt h \leqslant 25\)
38
\(0 \lt h \leqslant 30\)
40
(a) On the grid below, draw a cumulative frequency graph for this information.(2)
(b) Use the graph to find an estimate for the median height of the plants. (1)
Mark scheme (a)
Answer
Mark
Mark scheme
cf graph
M1
for 5 or 6 points plotted correctly
A1
for a fully correct graph
SC B1 if 5 or 6 of their points plotted not at the end but consistent within each interval and joined by a curve or line segments providing no gradient is negative
Additional guidance
If histograms drawn, points must be identified
Accept a smooth curve or line segments Ignore to the left of the first point and right of the last point
Mark scheme (b)
Answer
Mark
Mark scheme
13 to 14
B1
for answer in the range 13 to 14 or ft their cf graph