
Foundation June 2017 Paper 2 Q5
5 David sells CDs in a shop.
The tally chart shows information about the number of CDs David sold on Monday, on Tuesday and on Wednesday.
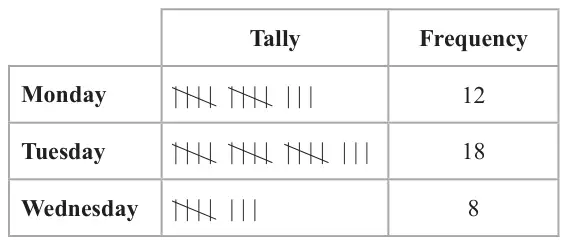
(a) Write down one thing that is wrong with the tally chart. (1)
David drew this pictogram to show the information for Tuesday and Wednesday.
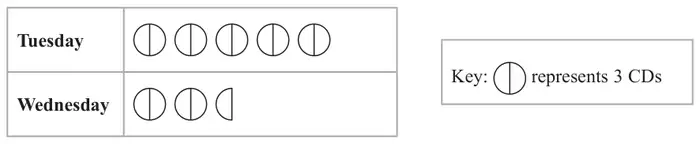
(b) Write down one thing that is wrong with this pictogram. (1)
| Answer | Mark | Notes |
|---|---|---|
| Monday wrong | C1 | for seeing difference in tally marks and frequency for Monday |
| Answer | Mark | Notes |
|---|---|---|
| Comment | C1 | for suitable comment, eg extra picture for Tuesday needed or explains that 0.5 of a CD is not possible |